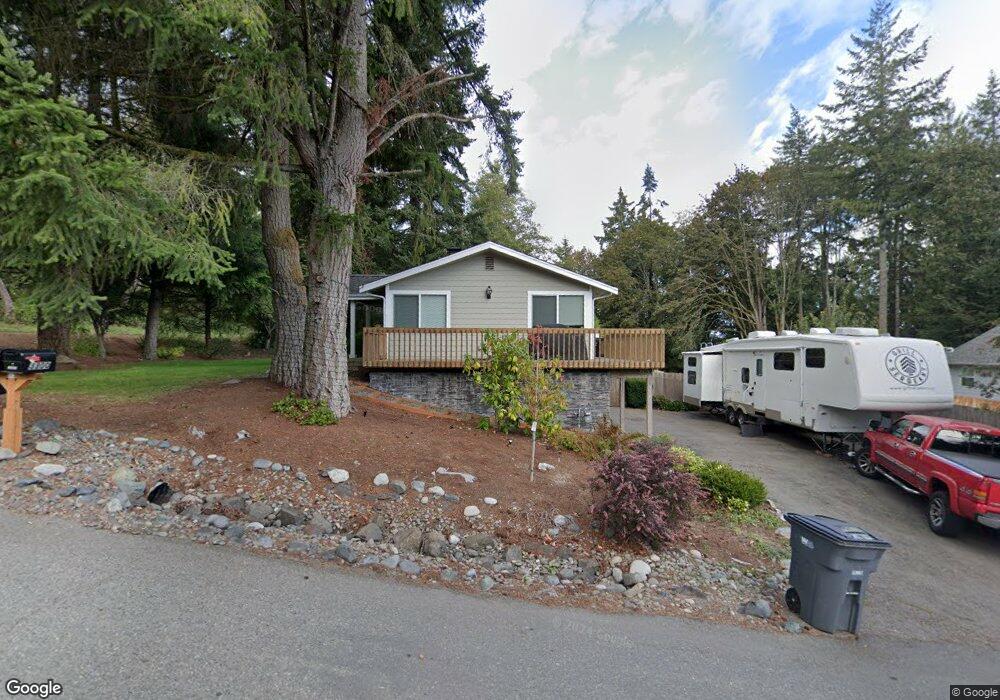
3300 NE 3rd St N Bremerton, WA 98311
Estimated Value: $485,000 - $543,000
3
Beds
2
Baths
2,204
Sq Ft
$232/Sq Ft
Est. Value
About This Home
This home is located at 3300 NE 3rd St N, Bremerton, WA 98311 and is currently estimated at $510,838, approximately $231 per square foot. 3300 NE 3rd St N is a home located in Kitsap County with nearby schools including Brownsville Elementary School, Ridgetop Middle School, and Olympic High School.
Ownership History
Date
Name
Owned For
Owner Type
Purchase Details
Closed on
Aug 25, 2012
Sold by
Moller Ellen E and Clarke Ellen E
Bought by
Moller Ellen E and Moller Charles B
Current Estimated Value
Home Financials for this Owner
Home Financials are based on the most recent Mortgage that was taken out on this home.
Original Mortgage
$242,000
Outstanding Balance
$166,821
Interest Rate
3.49%
Mortgage Type
New Conventional
Estimated Equity
$344,017
Purchase Details
Closed on
Aug 4, 2008
Sold by
Lew Terrence C M and Lew Bethany L
Bought by
Clarke Ellen E
Home Financials for this Owner
Home Financials are based on the most recent Mortgage that was taken out on this home.
Original Mortgage
$247,350
Interest Rate
6.42%
Mortgage Type
Unknown
Purchase Details
Closed on
Sep 3, 2004
Sold by
Lew Terrence C M
Bought by
Lew Terrence C M and Lew Bethany L
Purchase Details
Closed on
Jun 20, 2003
Sold by
Aaberg Carl E and Aaberg Hazel A
Bought by
Black Jay Bryan
Home Financials for this Owner
Home Financials are based on the most recent Mortgage that was taken out on this home.
Original Mortgage
$137,000
Interest Rate
5.37%
Mortgage Type
Unknown
Create a Home Valuation Report for This Property
The Home Valuation Report is an in-depth analysis detailing your home's value as well as a comparison with similar homes in the area
Home Values in the Area
Average Home Value in this Area
Purchase History
| Date | Buyer | Sale Price | Title Company |
|---|---|---|---|
| Moller Ellen E | -- | Accommodation | |
| Clarke Ellen E | $255,280 | Stewart Title | |
| Lew Terrence C M | -- | -- | |
| Black Jay Bryan | $155,000 | Land Title Company |
Source: Public Records
Mortgage History
| Date | Status | Borrower | Loan Amount |
|---|---|---|---|
| Open | Moller Ellen E | $242,000 | |
| Closed | Clarke Ellen E | $247,350 | |
| Previous Owner | Black Jay Bryan | $137,000 |
Source: Public Records
Tax History Compared to Growth
Tax History
| Year | Tax Paid | Tax Assessment Tax Assessment Total Assessment is a certain percentage of the fair market value that is determined by local assessors to be the total taxable value of land and additions on the property. | Land | Improvement |
|---|---|---|---|---|
| 2026 | $4,452 | $474,230 | $117,810 | $356,420 |
| 2025 | $4,452 | $474,230 | $117,810 | $356,420 |
| 2024 | $4,329 | $474,230 | $117,810 | $356,420 |
| 2023 | $4,344 | $474,230 | $117,810 | $356,420 |
| 2022 | $4,094 | $393,720 | $97,360 | $296,360 |
| 2021 | $4,148 | $380,210 | $72,190 | $308,020 |
| 2020 | $3,875 | $359,420 | $68,130 | $291,290 |
| 2019 | $3,619 | $324,830 | $61,990 | $262,840 |
| 2018 | $3,880 | $270,560 | $51,230 | $219,330 |
| 2017 | $3,448 | $270,560 | $51,230 | $219,330 |
| 2016 | $3,355 | $243,310 | $45,740 | $197,570 |
| 2015 | $2,997 | $226,370 | $50,670 | $175,700 |
| 2014 | -- | $216,100 | $50,670 | $165,430 |
| 2013 | -- | $216,100 | $50,670 | $165,430 |
Source: Public Records
Map
Nearby Homes
- 3380 NE 3rd St N Unit 29
- 3060 NE Mcwilliams Rd Unit 104
- 3060 NE Mcwilliams Rd Unit 9
- 6305 Rest Place NE
- 2940 Osiris Ct NE
- 3744 NE Trout Brook Ln
- 3703 NE Trout Brook Ln
- 3840 NE Ambleside Ln
- 3709 NE Liverpool Dr
- 3 Illahee Rd NE
- 3532 NE Shore Cliff St
- 4005 NE Derek Dr
- 2348 NE Windsor Ct
- 3000 NE Loyola St
- 6371 Illahee Rd NE
- 7550 Varsity Ln NE
- 0 University Point Cir NE
- 2112 NE Lexington Dr
- 5503 Fern Ave NE
- 7020 Saint Charles Ln NE
- 3312 NE 3rd St N
- 6676 Sunset Ave NE
- 6678 Sunset Ave NE
- 6562 Sunset Ave NE
- 3175 Aegean Blvd NE
- 3324 NE 3rd St N
- 6686 Takota Place NE
- 6680 Takota Place NE
- 6692 Takota Place NE
- 6698 Takota Place NE
- 3267 NE 3rd St N
- 6704 Takota Place NE
- 6710 Takota Place NE
- 3145 Aegean Blvd NE
- 6750 Corfu Blvd NE
- 6650 Sunset Ave NE
- 6716 Takota Place NE
- 3301 NE 3rd St N
- 6769 Kiowa Ave NE