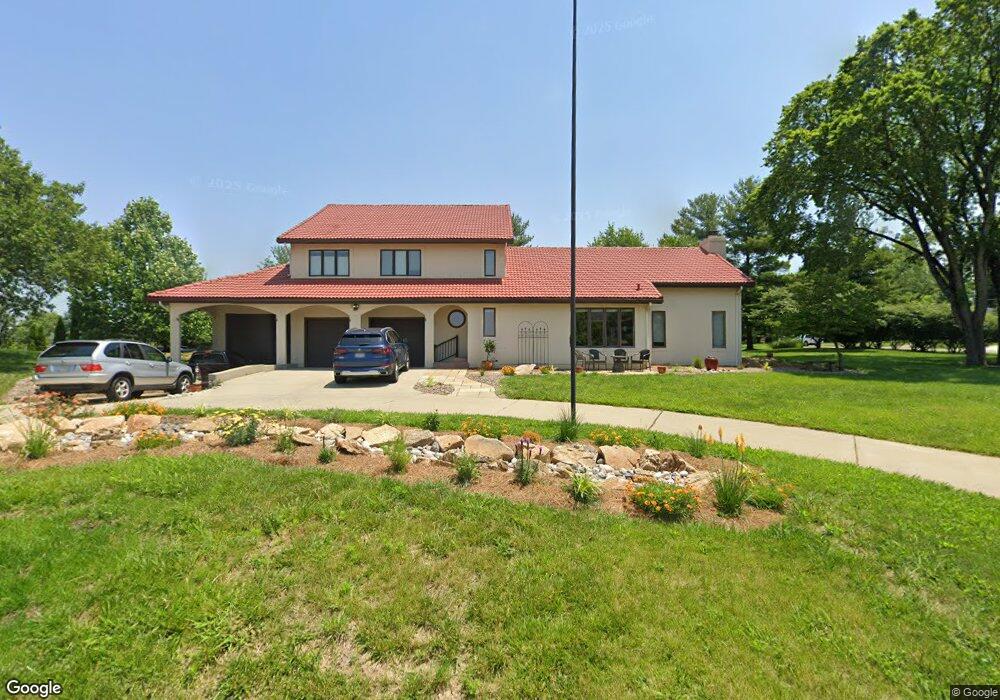
3300 Twilight Dr Cincinnati, OH 45241
Estimated Value: $639,143 - $788,000
3
Beds
3
Baths
2,940
Sq Ft
$239/Sq Ft
Est. Value
About This Home
This home is located at 3300 Twilight Dr, Cincinnati, OH 45241 and is currently estimated at $703,536, approximately $239 per square foot. 3300 Twilight Dr is a home located in Hamilton County with nearby schools including Edwin H Greene Intermediate Middle School, Sycamore Junior High School, and Sycamore High School.
Ownership History
Date
Name
Owned For
Owner Type
Purchase Details
Closed on
Apr 13, 2022
Sold by
Roy Nancy D and Roy Ronald G
Bought by
Back Nancy Roy and Back Ronald G
Current Estimated Value
Purchase Details
Closed on
May 23, 2012
Sold by
Roy Henry O
Bought by
Roy Henry O and Roy Nancy D
Create a Home Valuation Report for This Property
The Home Valuation Report is an in-depth analysis detailing your home's value as well as a comparison with similar homes in the area
Home Values in the Area
Average Home Value in this Area
Purchase History
| Date | Buyer | Sale Price | Title Company |
|---|---|---|---|
| Back Nancy Roy | -- | Cuni Ferguson & Levay Co Lpa | |
| Roy Henry O | -- | Attorney |
Source: Public Records
Tax History Compared to Growth
Tax History
| Year | Tax Paid | Tax Assessment Tax Assessment Total Assessment is a certain percentage of the fair market value that is determined by local assessors to be the total taxable value of land and additions on the property. | Land | Improvement |
|---|---|---|---|---|
| 2024 | $6,125 | $151,211 | $25,200 | $126,011 |
| 2023 | $6,131 | $151,211 | $25,200 | $126,011 |
| 2022 | $5,786 | $114,681 | $25,200 | $89,481 |
| 2021 | $5,624 | $114,681 | $25,200 | $89,481 |
| 2020 | $5,690 | $114,681 | $25,200 | $89,481 |
| 2019 | $6,186 | $112,532 | $25,200 | $87,332 |
| 2018 | $5,693 | $112,532 | $25,200 | $87,332 |
| 2017 | $5,330 | $112,532 | $25,200 | $87,332 |
| 2016 | $5,362 | $112,288 | $29,453 | $82,835 |
| 2015 | $5,415 | $112,288 | $29,453 | $82,835 |
| 2014 | $5,433 | $112,288 | $29,453 | $82,835 |
| 2013 | $5,360 | $113,421 | $29,750 | $83,671 |
Source: Public Records
Map
Nearby Homes
- 3577 Mohler Rd
- 3585 Fawnrun Dr
- 3490 Cooper Rd
- 3662 Cooper Rd
- 103 Bentwood Ct
- 16 Carpenters Run
- 10301 Giverny Blvd
- 162 E Crest Dr
- 2590 Hunt Rd
- 9495 Reading Rd
- 3590 Glendale Milford Rd
- 9481 Reading Rd
- 1626 Krylon Dr
- 3756 Glendale Milford Rd
- 2259 Pompano Ave
- 109 Calico Ct
- 3592 Horncastle Dr
- 2800 Maple Tree Ct
- 10561 Plainfield Rd
- 9870 Timbers Dr
- 3005 Twilight Dr
- 3005 Twilight Dr Unit 8
- 9905 Pheasantwalk Ct
- 3321 Twilight Dr
- 9917 Pheasantwalk Ct
- 3346 Twilight Dr
- 3327 Twilight Dr
- 3333 Twilight Dr
- 3339 Twilight Dr
- 2994 Twilight Dr
- 3295 Carpenters Creek Dr
- 3345 Twilight Dr
- 3352 Twilight Dr
- 9922 Pheasantwalk Ct
- 9906 Pheasantwalk Ct
- 2990 Twilight Dr
- 3283 Carpenters Creek Dr
- 2987 Twilight Dr
- 3351 Twilight Dr
- 2988 Twilight Dr