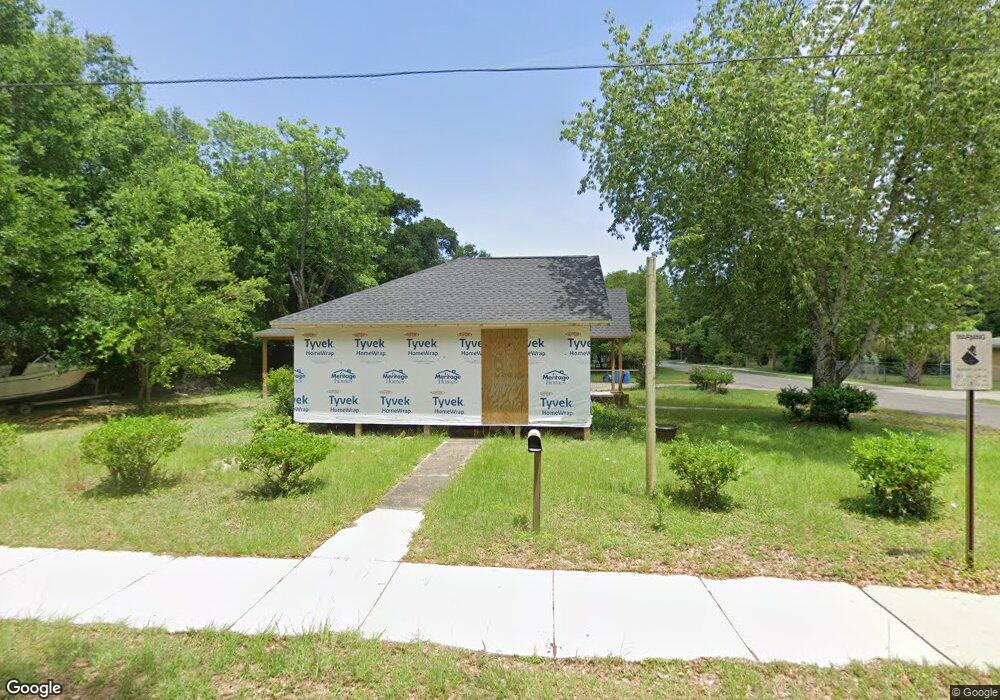
3300 W Lloyd St Pensacola, FL 32505
Estimated Value: $98,000 - $135,493
--
Bed
2
Baths
1,320
Sq Ft
$90/Sq Ft
Est. Value
About This Home
This home is located at 3300 W Lloyd St, Pensacola, FL 32505 and is currently estimated at $119,373, approximately $90 per square foot. 3300 W Lloyd St is a home located in Escambia County with nearby schools including Oakcrest Elementary School, Warrington Middle School, and Pensacola High School.
Ownership History
Date
Name
Owned For
Owner Type
Purchase Details
Closed on
Sep 13, 2023
Sold by
Cole Tony G
Bought by
Urbano Leonel G
Current Estimated Value
Purchase Details
Closed on
May 9, 2023
Sold by
Knight James E
Bought by
Knigh Antonio D
Purchase Details
Closed on
May 5, 2023
Sold by
Knight James
Bought by
Cole Tony G
Purchase Details
Closed on
Jun 3, 2021
Sold by
Tompkins Wayne L and Tompkins Laurie A
Bought by
Knight James
Purchase Details
Closed on
Sep 5, 2012
Sold by
Tompkins Wayne L
Bought by
Knight Rochelle S and Knight James E
Purchase Details
Closed on
Dec 16, 2009
Sold by
Tompkins Janie L and Tompkins Wayne L
Bought by
Tompkins Wayne L and Tompkins Laurie A
Purchase Details
Closed on
Apr 30, 2005
Sold by
Tompkins Janie L and Williams Brenda L
Bought by
Tompkins Janie L and Tompkins Wayne L
Create a Home Valuation Report for This Property
The Home Valuation Report is an in-depth analysis detailing your home's value as well as a comparison with similar homes in the area
Home Values in the Area
Average Home Value in this Area
Purchase History
| Date | Buyer | Sale Price | Title Company |
|---|---|---|---|
| Urbano Leonel G | $32,000 | None Listed On Document | |
| Urbano Leonel G | $32,000 | None Listed On Document | |
| Knigh Antonio D | $21,116 | None Listed On Document | |
| Cole Tony G | $100 | None Listed On Document | |
| Knight James | $21,116 | -- | |
| Knight James | $21,116 | None Listed On Document | |
| Knight Rochelle S | $42,300 | None Available | |
| Tompkins Wayne L | -- | None Available | |
| Tompkins Janie L | $11,000 | -- |
Source: Public Records
Tax History Compared to Growth
Tax History
| Year | Tax Paid | Tax Assessment Tax Assessment Total Assessment is a certain percentage of the fair market value that is determined by local assessors to be the total taxable value of land and additions on the property. | Land | Improvement |
|---|---|---|---|---|
| 2024 | $1,595 | $113,663 | $19,871 | $93,792 |
| 2023 | $1,595 | $108,880 | $0 | $0 |
| 2022 | $1,321 | $98,982 | $15,159 | $83,823 |
| 2021 | $1,176 | $76,669 | $0 | $0 |
| 2020 | $1,058 | $68,507 | $0 | $0 |
| 2019 | $1,038 | $66,445 | $0 | $0 |
| 2018 | $1,060 | $66,670 | $0 | $0 |
| 2017 | $1,015 | $62,114 | $0 | $0 |
| 2016 | $1,008 | $60,595 | $0 | $0 |
| 2015 | $960 | $58,063 | $0 | $0 |
| 2014 | $917 | $55,396 | $0 | $0 |
Source: Public Records
Map
Nearby Homes
- 3123 W Lloyd St
- 3120 W Lee St
- 3310 W De Soto St
- 3008 W Lloyd St
- 3020 W Gonzalez St
- 3002 W Brainerd St
- 1005 Grandview St
- 1122 N X St
- 0B Mobile Hwy
- 0A Mobile Hwy
- 2909 W Lee St
- 2910 W Lee St
- 2906 W Lee St
- 3707 W Lee St
- 1300 N W St
- 2828 W Gonzalez St
- 2816 W Lloyd St
- 3004 W Mallory St
- 3818 W Lloyd St
- 2906 W Moreno St
- 3304 W Lloyd St
- 1325 Shoemaker St
- 3305 W Lee St
- 3306 W Lloyd St
- 3301 W Lloyd St
- 3303 W Lloyd St
- 3305 W Lloyd St
- 3205 W Lee St
- 3307 W Lee St
- 3308 W Lloyd St
- 3204 W Lloyd St
- 3202 W Brainerd St
- 3307 W Lloyd St
- 3309 W Lee St
- 3310 W Lloyd St
- 3309 W Lloyd St
- 3304 W Lee St
- 3401 W Lee St
- 3300 W Brainerd St
- 3300 W Lee St