3301 14th St W Unit 2 Lehigh Acres, FL 33971
Richmond NeighborhoodEstimated Value: $252,000 - $408,000
3
Beds
2
Baths
1,688
Sq Ft
$184/Sq Ft
Est. Value
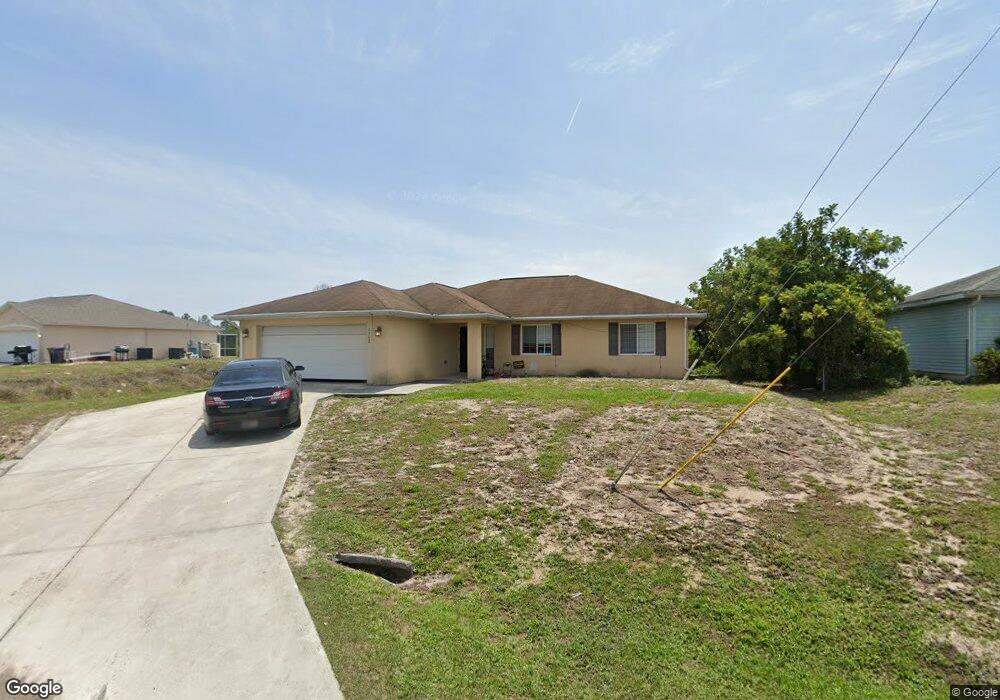
About This Home
This home is located at 3301 14th St W Unit 2, Lehigh Acres, FL 33971 and is currently estimated at $310,240, approximately $183 per square foot. 3301 14th St W Unit 2 is a home located in Lee County with nearby schools including Lehigh Elementary School, Gateway Elementary School, and The Alva School.
Ownership History
Date
Name
Owned For
Owner Type
Purchase Details
Closed on
May 31, 2012
Sold by
Riverland Property Llc
Bought by
Depelecyn Daniel and Weyer Tania Vande
Current Estimated Value
Purchase Details
Closed on
Feb 28, 2012
Sold by
Illg Brian C
Bought by
Riverland Property Llc
Purchase Details
Closed on
Jan 23, 2007
Sold by
Daviar Homes Inc
Bought by
Illg Brian C
Home Financials for this Owner
Home Financials are based on the most recent Mortgage that was taken out on this home.
Original Mortgage
$207,900
Interest Rate
9.5%
Mortgage Type
Unknown
Purchase Details
Closed on
Oct 9, 2006
Sold by
Jagessar Somawattie and Jagessar Teodat N
Bought by
Davlar Homes Inc
Purchase Details
Closed on
May 13, 2004
Sold by
Denny Carmen B
Bought by
Jagessar Teodat N and Jagessar Somawattie
Purchase Details
Closed on
Feb 2, 1994
Sold by
Davis George M
Bought by
Denny Carmen B
Create a Home Valuation Report for This Property
The Home Valuation Report is an in-depth analysis detailing your home's value as well as a comparison with similar homes in the area
Home Values in the Area
Average Home Value in this Area
Purchase History
| Date | Buyer | Sale Price | Title Company |
|---|---|---|---|
| Depelecyn Daniel | $80,000 | Safe Harbor Title Company | |
| Riverland Property Llc | $55,000 | Winged Foot Title Llc | |
| Illg Brian C | $207,900 | Attorney | |
| Davlar Homes Inc | $24,500 | None Available | |
| Jagessar Teodat N | $14,900 | -- | |
| Denny Carmen B | $1,000 | -- |
Source: Public Records
Mortgage History
| Date | Status | Borrower | Loan Amount |
|---|---|---|---|
| Previous Owner | Illg Brian C | $207,900 |
Source: Public Records
Tax History Compared to Growth
Tax History
| Year | Tax Paid | Tax Assessment Tax Assessment Total Assessment is a certain percentage of the fair market value that is determined by local assessors to be the total taxable value of land and additions on the property. | Land | Improvement |
|---|---|---|---|---|
| 2025 | $3,429 | $227,390 | $22,610 | $204,780 |
| 2024 | $3,429 | $208,579 | -- | -- |
| 2023 | $3,429 | $189,617 | $0 | $0 |
| 2022 | $3,049 | $172,379 | $0 | $0 |
| 2021 | $2,607 | $166,662 | $6,500 | $160,162 |
| 2020 | $2,502 | $155,854 | $6,000 | $149,854 |
| 2019 | $2,454 | $155,856 | $5,300 | $150,556 |
| 2018 | $2,312 | $143,730 | $5,000 | $138,730 |
| 2017 | $2,204 | $136,466 | $4,400 | $132,066 |
| 2016 | $2,002 | $115,295 | $4,400 | $110,895 |
| 2015 | $1,847 | $101,605 | $4,000 | $97,605 |
| 2014 | -- | $89,102 | $2,715 | $86,387 |
| 2013 | -- | $73,105 | $2,400 | $70,705 |
Source: Public Records
Map
Nearby Homes
- 3302 14th St W
- 3303 14th St W
- 3213 14th St W
- 3305 14th St W Unit 2
- 3304 14th St W
- 3211 14th St W
- 3302 13th St W
- 3212 14th St W
- 3306 W 13
- 3306 13th St W
- 3306 14th St W
- 3208 13th St W
- 3303 15th St W
- 3305 13th St W
- 3308 14th St W
- 3309 14th St W Unit 2
- 3207 14th St W
- 3213 13th St W Unit 8
- 3206 13th St W
- 3206 14th St W