3301 S Harrah Rd Harrah, OK 73045
Estimated Value: $262,000 - $512,000
3
Beds
2
Baths
1,573
Sq Ft
$227/Sq Ft
Est. Value
About This Home
This home is located at 3301 S Harrah Rd, Harrah, OK 73045 and is currently estimated at $356,754, approximately $226 per square foot. 3301 S Harrah Rd is a home located in Oklahoma County with nearby schools including Anna May Daulton Elementary School, Louise Cabaniss Elementary School, and Cora Spencer Elementary School.
Ownership History
Date
Name
Owned For
Owner Type
Purchase Details
Closed on
Feb 13, 2024
Sold by
Bill L Kelley Living Trust
Bought by
Carol J Kelley Trust
Current Estimated Value
Purchase Details
Closed on
Jan 20, 2018
Sold by
Nicklas Holly and Nicklas Jeff
Bought by
Kusek Tim and Nicklas Holly
Purchase Details
Closed on
Nov 2, 2017
Sold by
Nicklas Holly and Nicklas Jeff
Bought by
Kusek Tim and Nicklas Holly
Purchase Details
Closed on
Jan 9, 2017
Sold by
Kusek Tim
Bought by
Nicklas Holly
Purchase Details
Closed on
Jan 7, 2017
Sold by
Nicklas Holly and Nicklas Jeffrey
Bought by
Harrah Properties Llc
Purchase Details
Closed on
Aug 5, 2011
Sold by
Kusek Dora Lee
Bought by
Kusek Tim and Nicklas Holly
Purchase Details
Closed on
Aug 22, 2007
Sold by
Kusek Leo P and Kusek Dora Lee
Bought by
Kusek Leo P and Kusek Dora Lee
Create a Home Valuation Report for This Property
The Home Valuation Report is an in-depth analysis detailing your home's value as well as a comparison with similar homes in the area
Home Values in the Area
Average Home Value in this Area
Purchase History
| Date | Buyer | Sale Price | Title Company |
|---|---|---|---|
| Carol J Kelley Trust | -- | None Listed On Document | |
| Kusek Tim | -- | Stewart Title Of Oklahoma In | |
| Kusek Tim | -- | Accommodation | |
| Nicklas Holly | -- | None Available | |
| Harrah Properties Llc | -- | None Available | |
| Kusek Tim | -- | None Available | |
| Kusek Leo P | -- | None Available |
Source: Public Records
Tax History Compared to Growth
Tax History
| Year | Tax Paid | Tax Assessment Tax Assessment Total Assessment is a certain percentage of the fair market value that is determined by local assessors to be the total taxable value of land and additions on the property. | Land | Improvement |
|---|---|---|---|---|
| 2024 | $1,043 | $10,973 | $3,115 | $7,858 |
| 2023 | $1,043 | $10,654 | $1,764 | $8,890 |
| 2022 | $1,029 | $10,344 | $1,033 | $9,311 |
| 2021 | $999 | $10,043 | $1,534 | $8,509 |
| 2020 | $1,105 | $10,813 | $1,534 | $9,279 |
| 2019 | $1,103 | $10,813 | $1,534 | $9,279 |
| 2018 | $1,590 | $15,306 | $0 | $0 |
| 2017 | $1,514 | $14,858 | $1,754 | $13,104 |
| 2016 | $1,468 | $15,150 | $1,878 | $13,272 |
| 2015 | $1,488 | $15,486 | $1,878 | $13,608 |
| 2014 | $1,539 | $16,020 | $2,631 | $13,389 |
Source: Public Records
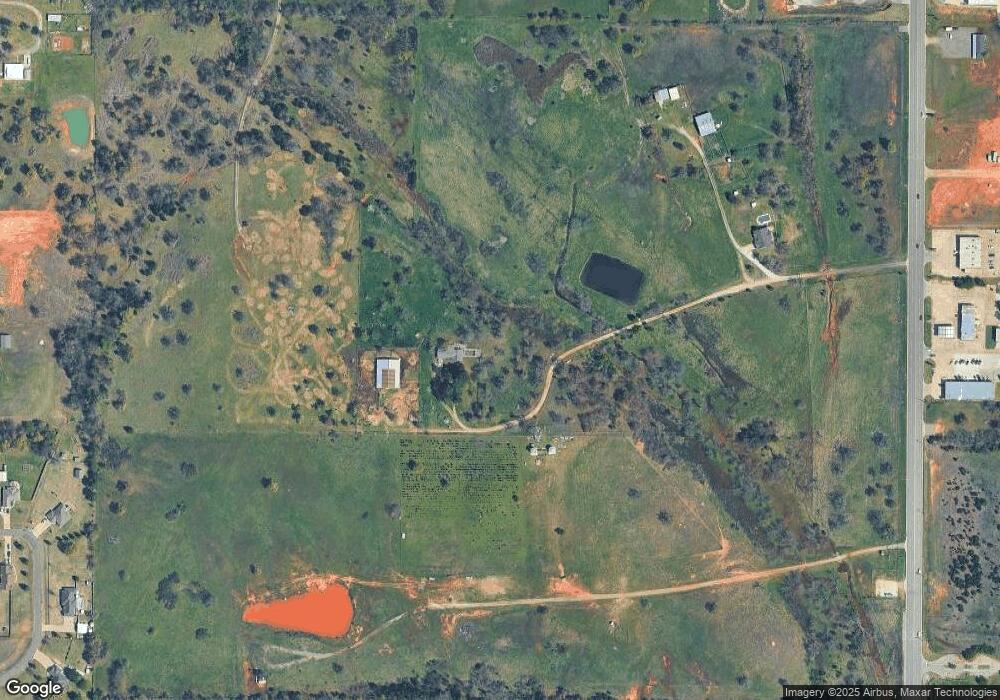
Map
Nearby Homes
- 3600 S Harrah Rd
- RC Wright Plan at River Mist
- RC Carnegie II Plan at River Mist
- RC Kinsley II Plan at River Mist
- RC Lowell II Plan at River Mist
- RC Coleman Plan at River Mist
- RC Raleigh Plan at River Mist
- RC Foster II Plan at River Mist
- 21094 River Mist Dr
- 3816 Ada Ave
- 3881 River Mist Lake Dr
- 21086 River Mist Dr
- 3833 Dove Ave
- 21097 Rivermist Dr
- 4332 Titan Terrace
- 4600 S Harrah Rd
- 3880 Louthea Ln
- 3888 Ada Ave
- 10112 Pennington St
- 10136 Pennington St
- 4044 S Deer Park Ln
- 4055 S Deer Park Ln
- 4100 S Deer Park Ln
- 4099 S Deer Park Ln
- 4044 Fawn Meadow Dr
- 4000 Fawn Meadow Dr
- 4166 S Deer Park Ln
- 4100 Fawn Meadow Dr
- 3401 S Harrah Rd
- 3287 S Harrah Rd
- 4177 S Deer Park Ln
- 4055 Fawn Meadow Dr
- 4242 S Deer Park Ln
- 3802 Woodmark Dr
- 3800 Woodmark Dr
- 20600 SE 39th St
- 4099 Fawn Meadow Dr
- 3820 Woodmark Dr
- 4255 S Deer Park Ln
- 4155 Fawn Meadow Dr