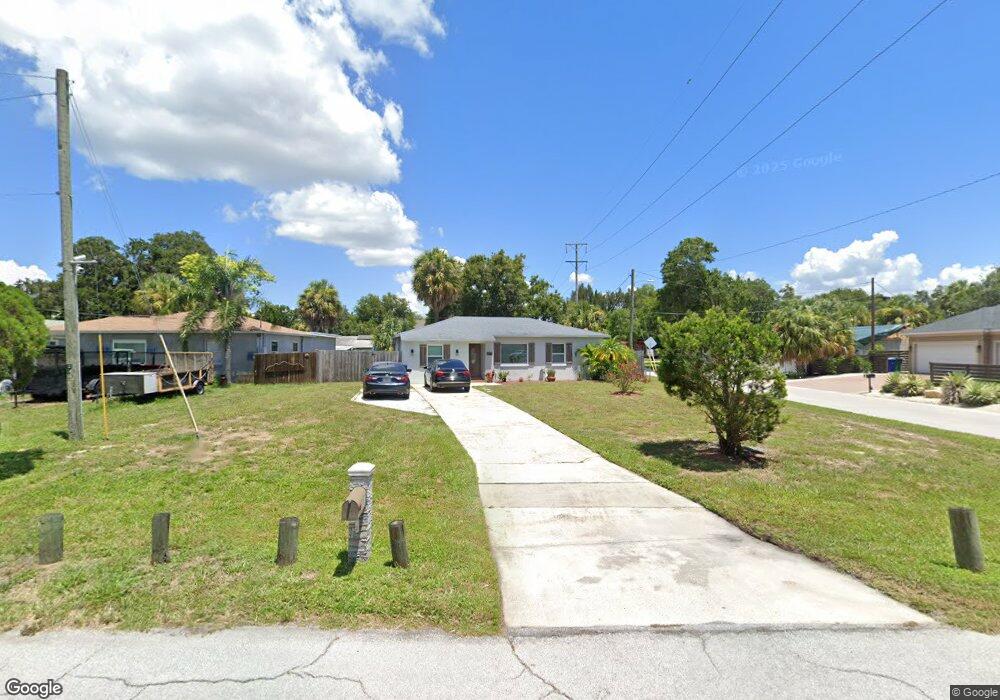
3301 W Pearl Ave Tampa, FL 33611
Sun Bay South NeighborhoodEstimated Value: $318,000 - $457,000
3
Beds
2
Baths
1,200
Sq Ft
$315/Sq Ft
Est. Value
About This Home
This home is located at 3301 W Pearl Ave, Tampa, FL 33611 and is currently estimated at $378,140, approximately $315 per square foot. 3301 W Pearl Ave is a home located in Hillsborough County with nearby schools including Chiaramonte Elementary School, Madison Middle School, and Robinson High School.
Ownership History
Date
Name
Owned For
Owner Type
Purchase Details
Closed on
Jul 15, 2014
Sold by
Dolphin Group Capital Ventures Llc
Bought by
Papapanu Jill D
Current Estimated Value
Home Financials for this Owner
Home Financials are based on the most recent Mortgage that was taken out on this home.
Original Mortgage
$165,483
Outstanding Balance
$126,237
Interest Rate
4.2%
Mortgage Type
VA
Estimated Equity
$251,903
Purchase Details
Closed on
Oct 1, 2013
Sold by
Lambert Vaughn
Bought by
Dolphin Group Capital Venture Llc
Purchase Details
Closed on
Jul 8, 1999
Sold by
Watts Brian C and Watts Leslee
Bought by
Lambert Vaughn and Lambert Lorraine
Home Financials for this Owner
Home Financials are based on the most recent Mortgage that was taken out on this home.
Original Mortgage
$55,350
Interest Rate
7.23%
Mortgage Type
New Conventional
Purchase Details
Closed on
Oct 3, 1996
Sold by
Ayers Candace
Bought by
Anderson Lee B and Anderson Leslie
Create a Home Valuation Report for This Property
The Home Valuation Report is an in-depth analysis detailing your home's value as well as a comparison with similar homes in the area
Home Values in the Area
Average Home Value in this Area
Purchase History
| Date | Buyer | Sale Price | Title Company |
|---|---|---|---|
| Papapanu Jill D | $162,000 | Bayshore Title Ins Agency | |
| Dolphin Group Capital Venture Llc | $94,000 | None Available | |
| Lambert Vaughn | $61,500 | -- | |
| Watts Brian C | $100 | -- | |
| Anderson Lee B | $53,000 | -- |
Source: Public Records
Mortgage History
| Date | Status | Borrower | Loan Amount |
|---|---|---|---|
| Open | Papapanu Jill D | $165,483 | |
| Previous Owner | Anderson Lee B | $29,348 | |
| Previous Owner | Anderson Lee B | $25,392 | |
| Previous Owner | Anderson Lee B | $55,350 |
Source: Public Records
Tax History Compared to Growth
Tax History
| Year | Tax Paid | Tax Assessment Tax Assessment Total Assessment is a certain percentage of the fair market value that is determined by local assessors to be the total taxable value of land and additions on the property. | Land | Improvement |
|---|---|---|---|---|
| 2024 | $105 | $293,287 | -- | -- |
| 2023 | $105 | $284,745 | $160,125 | $124,620 |
| 2022 | $4,603 | $262,153 | $144,875 | $117,278 |
| 2021 | $4,106 | $207,227 | $122,000 | $85,227 |
| 2020 | $3,795 | $193,684 | $122,000 | $71,684 |
| 2019 | $3,434 | $167,877 | $99,125 | $68,752 |
| 2018 | $3,202 | $157,404 | $0 | $0 |
| 2017 | $2,907 | $137,414 | $0 | $0 |
| 2016 | $1,642 | $118,159 | $0 | $0 |
| 2015 | $1,631 | $114,883 | $0 | $0 |
| 2014 | $2,077 | $117,623 | $0 | $0 |
| 2013 | -- | $89,367 | $0 | $0 |
Source: Public Records
Map
Nearby Homes
- 3312 W Pearl Ave
- 3311 W Paxton Ave
- 3207 W Pearl Ave
- 3202 W Tyson Ave
- 3410 W Rogers Ave
- 5302 S Himes Ave
- 5402 S Himes Ave
- 3105 W Cherokee Ave
- 3108 W Ballast Point Blvd
- 6202 S Macdill Ave
- 3501 W Paxton Ave
- 3502 W Rogers Ave
- 3110 W Price Ave
- 3213 Serenity Estates Ln
- 3209 Serenity Estates Ln
- 5623 Gaspar Oaks Dr
- 3201 Serenity Estates Ln
- 3308 W Wyoming Cir
- 3106 Bayshore Oaks Dr
- 5440 S Macdill Ave Unit 3K
- 3303 W Pearl Ave
- 3305 W Pearl Ave
- 3302 W Paxton Ave
- 5222 S Sheridan Rd
- 3304 W Paxton Ave
- 3224 W Paxton Ave
- 5224 S Sheridan Rd
- 3307 W Pearl Ave
- 3306 W Paxton Ave
- 3302 W Pearl Ave
- 3304 W Pearl Ave
- 3222 W Paxton Ave
- 3219 W Pearl Ave
- 3306 W Pearl Ave
- 3308 W Paxton Ave
- 3309 W Pearl Ave
- 3220 W Paxton Ave
- 3308 W Pearl Ave
- 3310 W Paxton Ave
- 3215 W Pearl Ave