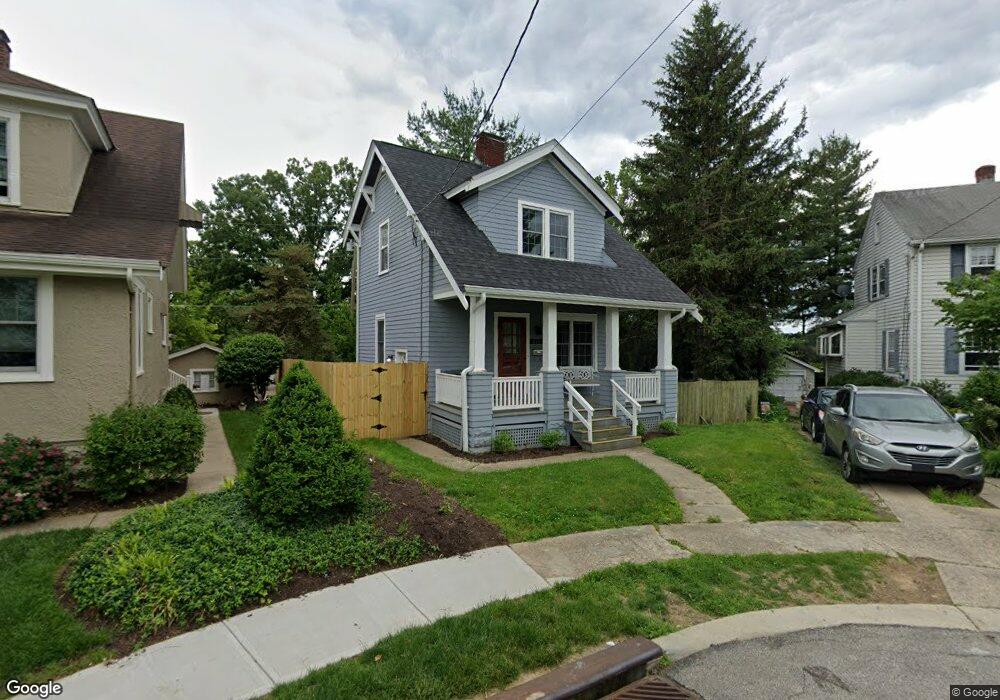
3301 Wiley Ln Cincinnati, OH 45208
Mount Lookout NeighborhoodEstimated Value: $569,000 - $1,108,000
3
Beds
2
Baths
2,750
Sq Ft
$320/Sq Ft
Est. Value
About This Home
This home is located at 3301 Wiley Ln, Cincinnati, OH 45208 and is currently estimated at $879,625, approximately $319 per square foot. 3301 Wiley Ln is a home located in Hamilton County with nearby schools including Kilgour Elementary School, Clark Montessori High School, and Shroder High School.
Ownership History
Date
Name
Owned For
Owner Type
Purchase Details
Closed on
Oct 7, 2005
Sold by
Jarrett Pamela and Michaels Dianne
Bought by
Thomas Richard S and Thomas Joanne M
Current Estimated Value
Home Financials for this Owner
Home Financials are based on the most recent Mortgage that was taken out on this home.
Original Mortgage
$209,250
Interest Rate
6.36%
Mortgage Type
Fannie Mae Freddie Mac
Purchase Details
Closed on
Sep 16, 2004
Sold by
Michaels John
Bought by
Michaels John and Michaels Family Revocable Living Trust
Purchase Details
Closed on
Apr 13, 2000
Sold by
Estate Of Dorothy Michaels
Bought by
Michaels John
Create a Home Valuation Report for This Property
The Home Valuation Report is an in-depth analysis detailing your home's value as well as a comparison with similar homes in the area
Home Values in the Area
Average Home Value in this Area
Purchase History
| Date | Buyer | Sale Price | Title Company |
|---|---|---|---|
| Thomas Richard S | -- | Classic Title Agency Llc | |
| Michaels John | -- | -- | |
| Michaels John | -- | -- |
Source: Public Records
Mortgage History
| Date | Status | Borrower | Loan Amount |
|---|---|---|---|
| Previous Owner | Thomas Richard S | $209,250 |
Source: Public Records
Tax History
| Year | Tax Paid | Tax Assessment Tax Assessment Total Assessment is a certain percentage of the fair market value that is determined by local assessors to be the total taxable value of land and additions on the property. | Land | Improvement |
|---|---|---|---|---|
| 2025 | $14,873 | $241,924 | $127,862 | $114,062 |
| 2024 | $13,105 | $241,924 | $127,862 | $114,062 |
| 2023 | $13,401 | $241,924 | $127,862 | $114,062 |
| 2022 | $13,928 | $227,060 | $112,851 | $114,209 |
| 2021 | $12,864 | $227,060 | $112,851 | $114,209 |
| 2020 | $13,242 | $227,060 | $112,851 | $114,209 |
| 2019 | $12,116 | $194,068 | $96,453 | $97,615 |
| 2018 | $12,135 | $194,068 | $96,453 | $97,615 |
| 2017 | $11,529 | $194,068 | $96,453 | $97,615 |
| 2016 | $8,365 | $189,641 | $90,605 | $99,036 |
| 2015 | $7,536 | $189,641 | $90,605 | $99,036 |
| 2014 | $7,951 | $170,601 | $90,605 | $79,996 |
| 2013 | $7,289 | $153,696 | $81,627 | $72,069 |
Source: Public Records
Map
Nearby Homes
- 1346 Herlin Place
- 3300 Linwood Ave
- 3220 Linwood Ave
- 3255 Linwood Ave
- 1134 Beverly Hill Dr
- 1225 Corbett St
- 3109 Linwood Ave
- 3059 Griest Ave
- 3110 Kinmont St
- 1338 Suncrest Dr
- 1 Hilltop Ln
- 3037 Griest Ave
- 1344 Delta Ave
- 1231 Grace Ave
- 3045 Spencer Hill Dr
- 3550 Linwood Ave
- 1005 Richwood Cir
- 3443 Ault View Ave
- 1002 Richwood Cir
- 3643 Russell Ave
- 1016 Omar Place
- 3305 Royal Place
- 3264 Lambert Place
- 3302 Lambert Place
- 3300 Lambert Place
- 1020 Omar Place
- 1012 Omar Place
- 3303 Royal Place
- 3313 Wiley Ln
- 3260 Lambert Place
- 3309 Royal Place
- 3310 Lambert Place
- 3256 Lambert Place
- 3315 Royal Place
- 3300 Royal Place
- 3256 Glengyle Ave
- 3312 Lambert Place
- 3317 Royal Place
- 3304 Royal Place
- 1021 Omar Place
Your Personal Tour Guide
Ask me questions while you tour the home.