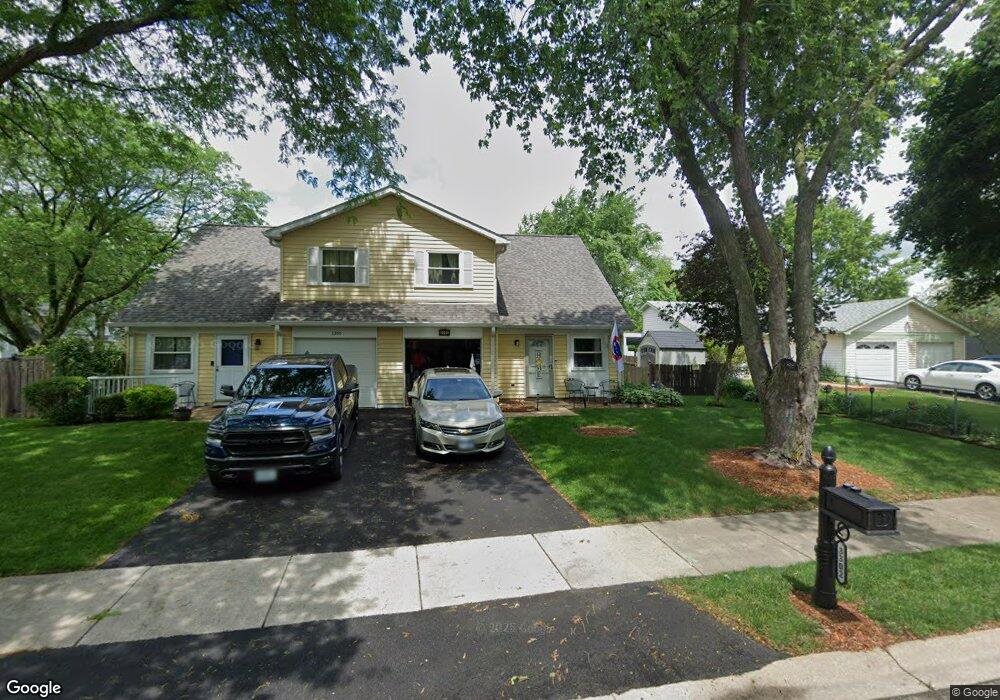
3302 Allspice Ct Aurora, IL 60504
South East Village NeighborhoodEstimated Value: $216,000 - $264,000
3
Beds
1
Bath
1,018
Sq Ft
$236/Sq Ft
Est. Value
About This Home
This home is located at 3302 Allspice Ct, Aurora, IL 60504 and is currently estimated at $240,286, approximately $236 per square foot. 3302 Allspice Ct is a home located in DuPage County with nearby schools including Georgetown Elementary School, Fischer Middle School, and Waubonsie Valley High School.
Ownership History
Date
Name
Owned For
Owner Type
Purchase Details
Closed on
Jul 18, 2005
Sold by
Sanchez Antonio and Billingsley Patricia B
Bought by
Payton Shannon
Current Estimated Value
Home Financials for this Owner
Home Financials are based on the most recent Mortgage that was taken out on this home.
Original Mortgage
$126,400
Outstanding Balance
$74,576
Interest Rate
7.74%
Mortgage Type
Purchase Money Mortgage
Estimated Equity
$165,710
Purchase Details
Closed on
Jun 29, 1998
Sold by
Reed Robert V and Reed Lisa Marie
Bought by
Sanchez Antonio and Billingsley Patricia B
Home Financials for this Owner
Home Financials are based on the most recent Mortgage that was taken out on this home.
Original Mortgage
$92,434
Interest Rate
7.15%
Mortgage Type
FHA
Purchase Details
Closed on
Jun 30, 1995
Sold by
Possedi Kevin D
Bought by
Reed Robert V and Reed Lisa Marie
Home Financials for this Owner
Home Financials are based on the most recent Mortgage that was taken out on this home.
Original Mortgage
$84,867
Interest Rate
7.9%
Mortgage Type
FHA
Create a Home Valuation Report for This Property
The Home Valuation Report is an in-depth analysis detailing your home's value as well as a comparison with similar homes in the area
Home Values in the Area
Average Home Value in this Area
Purchase History
| Date | Buyer | Sale Price | Title Company |
|---|---|---|---|
| Payton Shannon | $158,000 | First American Title | |
| Sanchez Antonio | $93,000 | Chicago Title Insurance Co | |
| Reed Robert V | $86,500 | -- |
Source: Public Records
Mortgage History
| Date | Status | Borrower | Loan Amount |
|---|---|---|---|
| Open | Payton Shannon | $126,400 | |
| Previous Owner | Sanchez Antonio | $92,434 | |
| Previous Owner | Reed Robert V | $84,867 |
Source: Public Records
Tax History
| Year | Tax Paid | Tax Assessment Tax Assessment Total Assessment is a certain percentage of the fair market value that is determined by local assessors to be the total taxable value of land and additions on the property. | Land | Improvement |
|---|---|---|---|---|
| 2024 | $4,168 | $62,823 | $21,256 | $41,567 |
| 2023 | $3,937 | $56,450 | $19,100 | $37,350 |
| 2022 | $3,708 | $50,220 | $16,870 | $33,350 |
| 2021 | $3,599 | $48,430 | $16,270 | $32,160 |
| 2020 | $3,643 | $48,430 | $16,270 | $32,160 |
| 2019 | $3,500 | $46,060 | $15,470 | $30,590 |
| 2018 | $2,146 | $30,300 | $10,330 | $19,970 |
| 2017 | $1,935 | $27,480 | $9,370 | $18,110 |
| 2016 | $1,746 | $24,880 | $8,480 | $16,400 |
| 2015 | $1,704 | $23,620 | $8,050 | $15,570 |
| 2014 | $1,636 | $22,420 | $7,580 | $14,840 |
| 2013 | $1,622 | $22,570 | $7,630 | $14,940 |
Source: Public Records
Map
Nearby Homes
- 3389 Ravinia Cir
- 3110 Timber Hill Ln Unit 13B
- 3115 Village Green Dr
- 3094 Fairfield Ln
- 2950 Shelly Ln Unit 2950
- 3467 Charlemaine Dr
- 3431 Charlemaine Dr
- 3479 Charlemaine Dr
- 465 Echo Ln Unit 2
- 351 Park Ridge Ln Unit D
- 2797 Shelly Ln
- 2750 Shelly Ln
- 515 Cimarron Dr W Unit 20A
- 537 Watercress Dr
- 533 Watercress Dr
- 534 Watercress Dr
- 300 Churchill Ln
- 573 Watercress Dr
- 579 Watercress Dr
- 205 Churchill Ln
- 3310 Allspice Ct Unit 13C
- 3300 Allspice Ct Unit 13C
- 3312 Allspice Ct Unit 13C
- 3282 Fox Hill Rd Unit 13C
- 3280 Fox Hill Rd Unit 13C
- 3320 Allspice Ct
- 3272 Fox Hill Rd
- 3307 Allspice Ct Unit 136
- 3322 Allspice Ct
- 3305 Allspice Ct
- 3297 Fox Hill Rd
- 3295 Fox Hill Rd Unit 13C
- 3270 Fox Hill Rd
- 3287 Fox Hill Rd Unit 13C
- 3315 Allspice Ct Unit 13C
- 3330 Allspice Ct
- 3317 Allspice Ct
- 3285 Fox Hill Rd
- 3310 Fox Hill Rd
- 3297 Allspice Ct Unit 13C
Your Personal Tour Guide
Ask me questions while you tour the home.