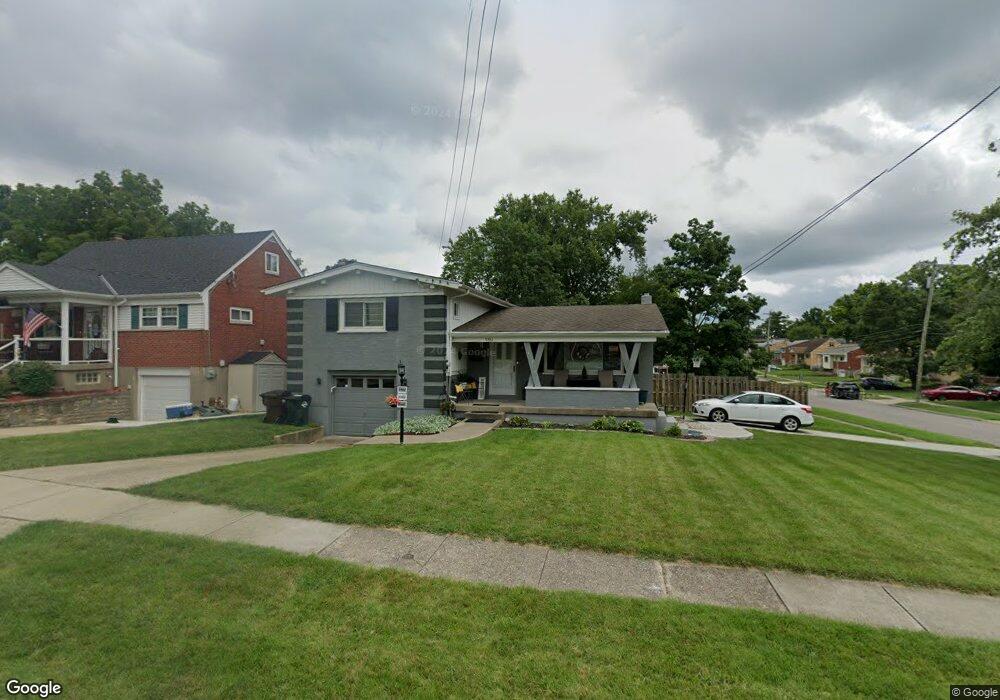
3302 Cresentview Ln Cincinnati, OH 45248
Estimated Value: $260,695 - $301,000
3
Beds
2
Baths
1,517
Sq Ft
$182/Sq Ft
Est. Value
About This Home
This home is located at 3302 Cresentview Ln, Cincinnati, OH 45248 and is currently estimated at $276,674, approximately $182 per square foot. 3302 Cresentview Ln is a home located in Hamilton County with nearby schools including Oakdale Elementary School, Bridgetown Middle School, and Oak Hills High School.
Ownership History
Date
Name
Owned For
Owner Type
Purchase Details
Closed on
Aug 17, 2007
Sold by
Stephens Amy R and Gunnels Michael J
Bought by
Jennings Ted and Jennings Wendy
Current Estimated Value
Home Financials for this Owner
Home Financials are based on the most recent Mortgage that was taken out on this home.
Original Mortgage
$166,300
Outstanding Balance
$104,041
Interest Rate
6.79%
Mortgage Type
Unknown
Estimated Equity
$172,633
Purchase Details
Closed on
Jun 3, 2004
Sold by
Stephens Kathleen Ann and Stephens Bryan W
Bought by
Stephens Amy R
Purchase Details
Closed on
Feb 27, 1997
Sold by
Leonora Schiesler and Leonora M
Bought by
Stephens Kathleen Ann
Create a Home Valuation Report for This Property
The Home Valuation Report is an in-depth analysis detailing your home's value as well as a comparison with similar homes in the area
Home Values in the Area
Average Home Value in this Area
Purchase History
| Date | Buyer | Sale Price | Title Company |
|---|---|---|---|
| Jennings Ted | $171,500 | Advanced Land Title Agency | |
| Stephens Amy R | -- | -- | |
| Stephens Kathleen Ann | -- | -- |
Source: Public Records
Mortgage History
| Date | Status | Borrower | Loan Amount |
|---|---|---|---|
| Open | Jennings Ted | $166,300 |
Source: Public Records
Tax History
| Year | Tax Paid | Tax Assessment Tax Assessment Total Assessment is a certain percentage of the fair market value that is determined by local assessors to be the total taxable value of land and additions on the property. | Land | Improvement |
|---|---|---|---|---|
| 2025 | $3,634 | $69,724 | $14,088 | $55,636 |
| 2023 | $3,547 | $69,724 | $14,088 | $55,636 |
| 2022 | $3,169 | $52,788 | $12,597 | $40,191 |
| 2021 | $2,846 | $51,111 | $12,597 | $38,514 |
| 2020 | $2,792 | $51,111 | $12,597 | $38,514 |
| 2019 | $2,732 | $45,634 | $11,246 | $34,388 |
| 2018 | $2,736 | $45,634 | $11,246 | $34,388 |
| 2017 | $2,579 | $45,634 | $11,246 | $34,388 |
| 2016 | $2,489 | $43,975 | $11,554 | $32,421 |
| 2015 | $2,510 | $43,975 | $11,554 | $32,421 |
| 2014 | $2,514 | $43,975 | $11,554 | $32,421 |
| 2013 | $2,373 | $44,419 | $11,669 | $32,750 |
Source: Public Records
Map
Nearby Homes
- 5584 Green Acres Ct
- 3311 Starhaven Trail
- 3157 Westbourne Dr
- 5638 N Glen Rd
- 5465 Childs Ave
- 5809 Harborpoint Dr
- 3454 Eyrich Rd
- 5696 Biscayne Ave
- 5448 Robert Ave
- 2985 Welge Ln
- 5452 Karen Ave
- 3570 Eyrich Rd
- 5549 Surrey Ave
- 3589 Eyrich Rd
- 5517 Surrey Ave
- 2713 Falconbridge Dr
- 2819 Springwood Ct
- 5913 Countryhills Dr
- 4269 Grotto Ct
- 3599 Schwartze Ave
- 3308 Cresentview Ln
- 3314 Cresentview Ln
- 3301 Glenmont Ln
- 5627 Woodhaven Dr
- 5619 Woodhaven Dr
- 3318 Cresentview Ln
- 5635 Woodhaven Dr
- 3313 Glenmont Ln
- 5611 Woodhaven Dr
- 3301 Cresentview Ln
- 3307 Cresentview Ln
- 5643 Woodhaven Dr
- 3317 Glenmont Ln
- 5605 Woodhaven Dr
- 3324 Cresentview Ln
- 3313 Cresentview Ln
- 5595 Woodhaven Dr
- 3296 Bellacre Ct
- 5651 Woodhaven Dr
- 3317 Cresentview Ln
Your Personal Tour Guide
Ask me questions while you tour the home.