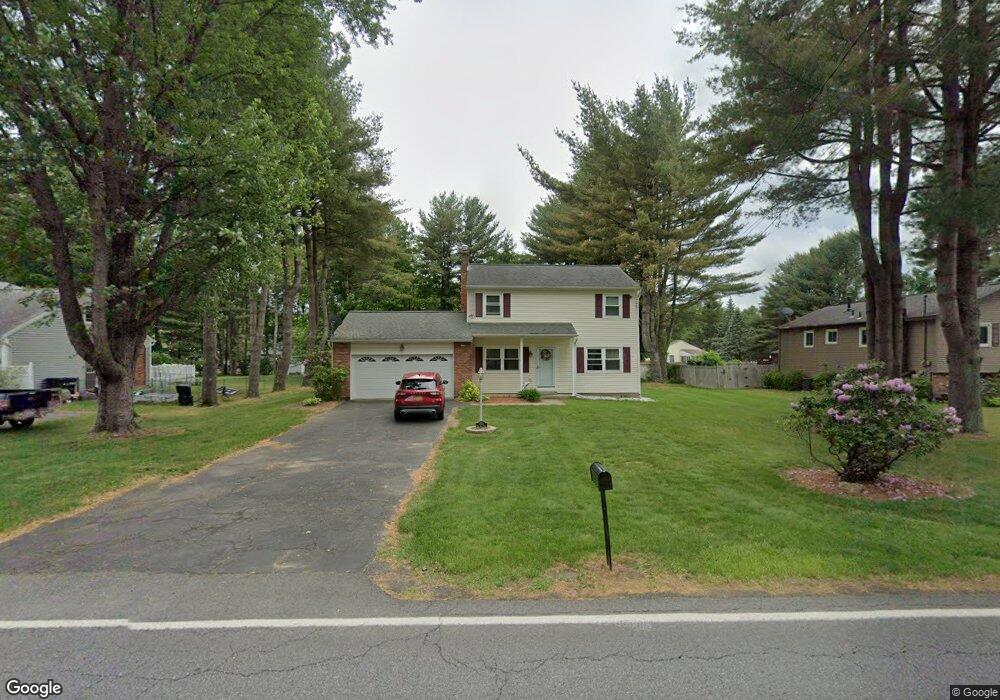
3302 E Old State Rd Schenectady, NY 12303
Estimated Value: $380,000 - $729,000
3
Beds
2
Baths
1,508
Sq Ft
$320/Sq Ft
Est. Value
About This Home
This home is located at 3302 E Old State Rd, Schenectady, NY 12303 and is currently estimated at $483,024, approximately $320 per square foot. 3302 E Old State Rd is a home located in Albany County with nearby schools including Lynnwood Elementary School, Farnsworth Middle School, and Guilderland High School.
Ownership History
Date
Name
Owned For
Owner Type
Purchase Details
Closed on
Aug 12, 2021
Sold by
Riggs Gerald J
Bought by
Griggs Gerald J and Griggs Kathy M
Current Estimated Value
Home Financials for this Owner
Home Financials are based on the most recent Mortgage that was taken out on this home.
Original Mortgage
$208,253
Outstanding Balance
$186,802
Interest Rate
2.87%
Estimated Equity
$296,222
Purchase Details
Closed on
Jul 10, 2020
Sold by
Nuttall Robert J and Nuttall Susan E
Bought by
Cosgriff Robby and Cosgriff Amanda
Purchase Details
Closed on
Oct 17, 2011
Sold by
Warren Ryan S and Warren Catherine M
Bought by
Cosgriff Robby F and Cosgriff Amanda L
Home Financials for this Owner
Home Financials are based on the most recent Mortgage that was taken out on this home.
Original Mortgage
$200,700
Interest Rate
4.25%
Purchase Details
Closed on
Apr 23, 2004
Sold by
Neaton Ronald A
Bought by
Warren Ryan S
Create a Home Valuation Report for This Property
The Home Valuation Report is an in-depth analysis detailing your home's value as well as a comparison with similar homes in the area
Home Values in the Area
Average Home Value in this Area
Purchase History
| Date | Buyer | Sale Price | Title Company |
|---|---|---|---|
| Griggs Gerald J | -- | Mortgage Connect Lp | |
| Cosgriff Robby | $400,000 | Chicago Title Ins Co | |
| Cosgriff Robby F | $223,000 | None Available | |
| Warren Ryan S | $166,000 | Breakell |
Source: Public Records
Mortgage History
| Date | Status | Borrower | Loan Amount |
|---|---|---|---|
| Open | Griggs Gerald J | $208,253 | |
| Previous Owner | Cosgriff Robby F | $200,700 |
Source: Public Records
Tax History
| Year | Tax Paid | Tax Assessment Tax Assessment Total Assessment is a certain percentage of the fair market value that is determined by local assessors to be the total taxable value of land and additions on the property. | Land | Improvement |
|---|---|---|---|---|
| 2025 | $7,105 | $245,000 | $49,000 | $196,000 |
| 2024 | $7,105 | $245,000 | $49,000 | $196,000 |
| 2023 | $6,889 | $245,000 | $49,000 | $196,000 |
| 2022 | $6,702 | $245,000 | $49,000 | $196,000 |
| 2021 | $6,486 | $245,000 | $49,000 | $196,000 |
| 2020 | $5,886 | $245,000 | $49,000 | $196,000 |
| 2019 | $5,270 | $245,000 | $49,000 | $196,000 |
| 2018 | $4,547 | $171,400 | $34,300 | $137,100 |
| 2017 | $0 | $171,400 | $34,300 | $137,100 |
| 2016 | $5,219 | $171,400 | $34,300 | $137,100 |
| 2015 | -- | $171,400 | $34,300 | $137,100 |
| 2014 | -- | $171,400 | $34,300 | $137,100 |
Source: Public Records
Map
Nearby Homes
- 1640 Angelina Terrace
- 3131 Spawn Rd
- 3067 Sunset Ln
- 2023 Philomena Dr
- 933 E Pine Hill Dr
- 2 Torrin
- 627 Via Ponderosa
- 5955 Curry Rd Extension
- 3009 Acorn Ct
- 5105 Western Turnpike
- 223 Pinewood Dr
- 1 Gilmore Terrace
- 56 Whispering Pines Way
- 57 Whispering Pines Way
- 109 Whispering Pines Way
- 55 Whispering Pines Way
- 105 Whispering Pines Way
- 104 Whispering Pines Way
- 58 Whispering Pines Way
- 107 Whispering Pines Way
- 3306 E Old State Rd
- 3298 E Old State Rd
- 6978 Suzanne Ln
- 6974 Suzanne Ln
- 3310 E Old State Rd
- 6982 Suzanne Ln
- 4001 Luigi Ct
- 3301 E Old State Rd
- 5000 Luigi Dr
- 3305 E Old State Rd
- 6986 Suzanne Ln
- 3290 E Old State Rd
- 6979 Suzanne Ln
- 6970 Suzanne Ct
- 4003 Luigi Ct
- 6975 Suzanne Ct
- 6975 Suzanne Ln
- 4000 Luigi Ct
- 3286 E Old State Rd
- 6971 Suzanne Ct
Your Personal Tour Guide
Ask me questions while you tour the home.