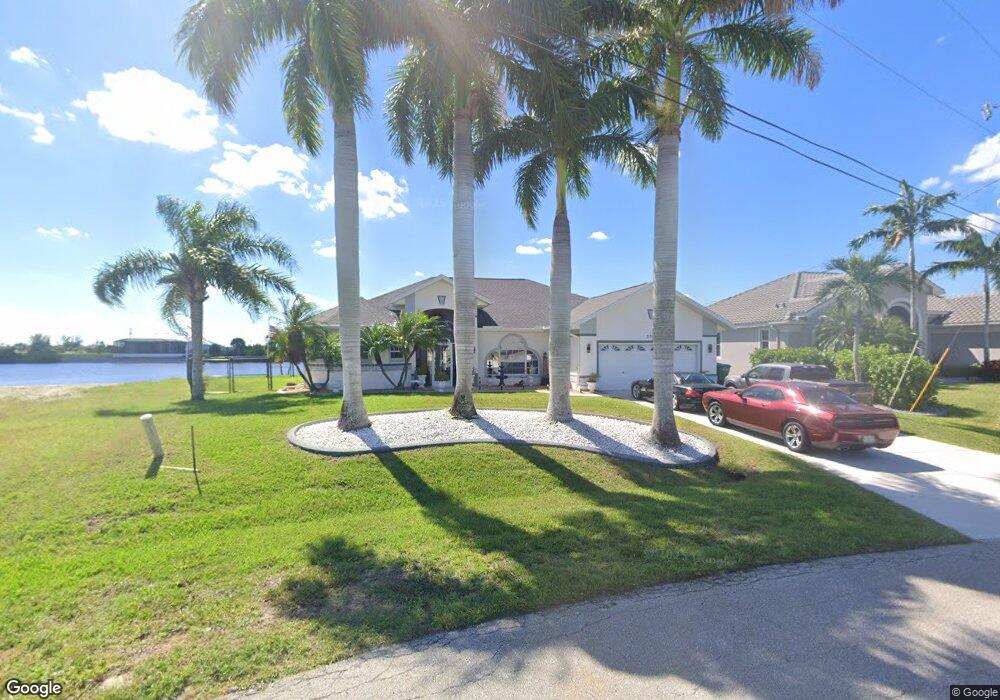
3302 NW 10th St Cape Coral, FL 33993
Burnt Store NeighborhoodEstimated Value: $594,000 - $728,000
3
Beds
2
Baths
2,733
Sq Ft
$241/Sq Ft
Est. Value
About This Home
This home is located at 3302 NW 10th St, Cape Coral, FL 33993 and is currently estimated at $659,210, approximately $241 per square foot. 3302 NW 10th St is a home located in Lee County with nearby schools including Caloosa Elementary School, Dr. Carrie D. Robinson Littleton Elementary School, and Tropic Isles Elementary School.
Ownership History
Date
Name
Owned For
Owner Type
Purchase Details
Closed on
Jun 25, 2025
Sold by
Jacobson Rita J
Bought by
Jacobson Rita J and Jacobson John
Current Estimated Value
Purchase Details
Closed on
Sep 8, 2012
Sold by
Jacobson Eric P and Jacobson Rita J
Bought by
Jacobson Rita J
Purchase Details
Closed on
Aug 8, 2003
Sold by
Spaman Morgan P and Spaman Sherry A
Bought by
Jacobson Eric P
Home Financials for this Owner
Home Financials are based on the most recent Mortgage that was taken out on this home.
Original Mortgage
$175,000
Interest Rate
6.33%
Purchase Details
Closed on
Apr 24, 2003
Sold by
Siegfried Ulrich and Siegfried Ursula
Bought by
Spaman Morgan P and Spaman Sherry A
Purchase Details
Closed on
Jan 10, 2001
Sold by
Siegfried Ulrich and Siegfried Ursula
Bought by
Spaman Morgan P and Spaman Sherry A
Create a Home Valuation Report for This Property
The Home Valuation Report is an in-depth analysis detailing your home's value as well as a comparison with similar homes in the area
Home Values in the Area
Average Home Value in this Area
Purchase History
| Date | Buyer | Sale Price | Title Company |
|---|---|---|---|
| Jacobson Rita J | $100 | None Listed On Document | |
| Jacobson Rita J | -- | Attorney | |
| Jacobson Eric P | $326,000 | -- | |
| Spaman Morgan P | -- | -- | |
| Spaman Morgan P | $26,000 | -- |
Source: Public Records
Mortgage History
| Date | Status | Borrower | Loan Amount |
|---|---|---|---|
| Previous Owner | Jacobson Eric P | $175,000 |
Source: Public Records
Tax History Compared to Growth
Tax History
| Year | Tax Paid | Tax Assessment Tax Assessment Total Assessment is a certain percentage of the fair market value that is determined by local assessors to be the total taxable value of land and additions on the property. | Land | Improvement |
|---|---|---|---|---|
| 2025 | $4,794 | $295,432 | -- | -- |
| 2024 | $4,794 | $287,106 | -- | -- |
| 2023 | $4,634 | $278,744 | $0 | $0 |
| 2022 | $4,361 | $270,625 | $0 | $0 |
| 2021 | $4,486 | $389,061 | $73,250 | $315,811 |
| 2020 | $4,560 | $259,115 | $0 | $0 |
| 2019 | $4,427 | $253,289 | $0 | $0 |
| 2018 | $4,424 | $248,566 | $0 | $0 |
| 2017 | $4,409 | $243,453 | $0 | $0 |
| 2016 | $4,328 | $311,369 | $67,984 | $243,385 |
| 2015 | $4,374 | $303,887 | $64,619 | $239,268 |
| 2014 | $6,314 | $302,606 | $53,505 | $249,101 |
| 2013 | -- | $253,290 | $58,707 | $194,583 |
Source: Public Records
Map
Nearby Homes
- 1013 NW 33rd Ave
- 2500 NW 7th St
- 1245 NW 35th Place
- 3816 Burnt Store Rd N
- 1005 NW 31st Place
- 4113 NW 22nd St
- 801 Larch Rd
- 1820 NW 21st St
- 4528 NW 35th Place
- 1722 NW 2nd Place
- 1715 Tropicana Pkwy W
- 27 NW 19th Terrace Unit 91
- 3902 NW 37th Ave
- 3427 NW 17th Ln
- 1008 NW 33rd Ave
- 1015 NW 33rd Ave
- 3324 NW 10th St
- 919 NW 32nd Place
- 1024 NW 33rd Ave
- 1020 NW 33rd Place
- 1001 NW 33rd Ave
- 3306 NW 10th St
- 3310 NW 10th St
- 1003 NW 33rd Place
- 1003 NW 33rd Ave
- 1001 NW 33rd Place
- 1004 NW 33rd Ave Unit 53
- 1005 NW 33rd Place
- 3318 NW 10th St
- 1528 NW 329th Place
- 1835 0
- 2543 NW 25th Terrace
- 19th Nw Place
- 28 NW 815
- 1420 NW 33rd Place Unit 5
- 1216 NW 30th Place Unit 25
- 1715 Tropicana Pkwy W Unit 54
- 3816 Burnt Store Rd N Unit 14
- 4528 NW 35th Place Unit 35
- 3427 NW 17th Ln Unit 14