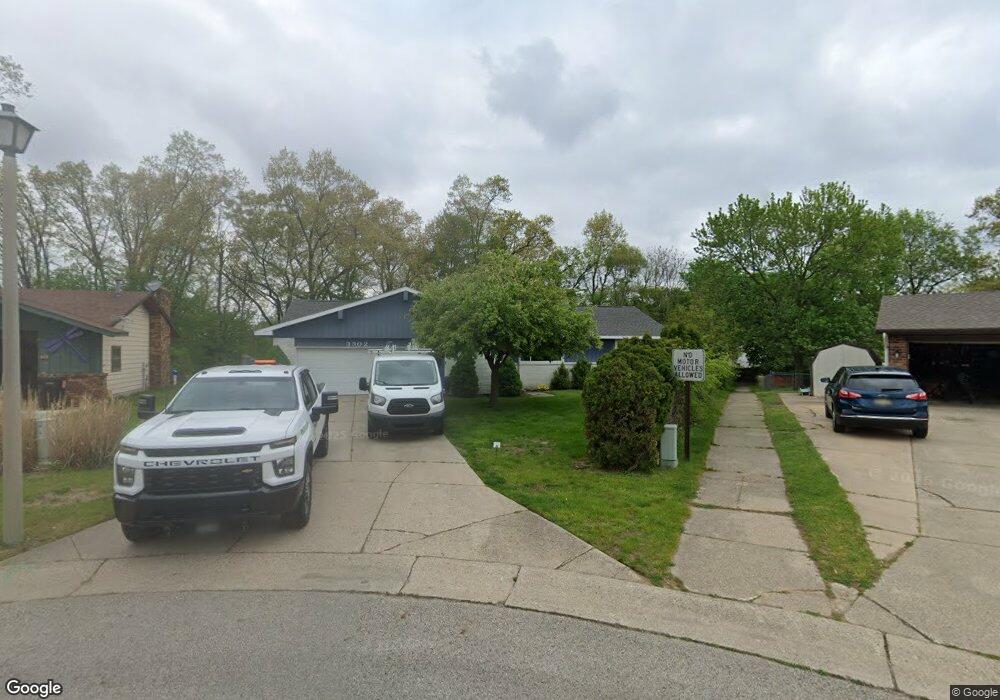
3302 Perry Ave SW Wyoming, MI 49519
Byron Center Park NeighborhoodEstimated Value: $312,000 - $331,000
2
Beds
2
Baths
2,021
Sq Ft
$160/Sq Ft
Est. Value
About This Home
This home is located at 3302 Perry Ave SW, Wyoming, MI 49519 and is currently estimated at $324,152, approximately $160 per square foot. 3302 Perry Ave SW is a home located in Kent County with nearby schools including Oriole Park Elementary School, Gladiola Elementary School, and West Elementary School.
Ownership History
Date
Name
Owned For
Owner Type
Purchase Details
Closed on
Aug 26, 2021
Sold by
Sikkema Amber
Bought by
Sikkema Amber and Sikkema Brandon
Current Estimated Value
Home Financials for this Owner
Home Financials are based on the most recent Mortgage that was taken out on this home.
Original Mortgage
$212,000
Outstanding Balance
$189,751
Interest Rate
2.8%
Mortgage Type
New Conventional
Estimated Equity
$134,401
Purchase Details
Closed on
Jun 29, 2018
Sold by
Ryke Robert A and Ryke Erin
Bought by
Sikkema Amber
Home Financials for this Owner
Home Financials are based on the most recent Mortgage that was taken out on this home.
Original Mortgage
$162,011
Interest Rate
4.37%
Mortgage Type
FHA
Purchase Details
Closed on
Jun 27, 2008
Sold by
The Walker Living Trust
Bought by
Mccullough Erin and Ryke Robert A
Home Financials for this Owner
Home Financials are based on the most recent Mortgage that was taken out on this home.
Original Mortgage
$123,954
Interest Rate
6.1%
Mortgage Type
FHA
Purchase Details
Closed on
Jun 12, 1992
Sold by
Walker George H and Walker Betty
Bought by
Walker Trust George and Walker Trust Betty
Create a Home Valuation Report for This Property
The Home Valuation Report is an in-depth analysis detailing your home's value as well as a comparison with similar homes in the area
Home Values in the Area
Average Home Value in this Area
Purchase History
| Date | Buyer | Sale Price | Title Company |
|---|---|---|---|
| Sikkema Amber | -- | None Available | |
| Sikkema Amber | $165,000 | Chicago Title | |
| Mccullough Erin | $125,900 | None Available | |
| Walker Trust George | -- | -- |
Source: Public Records
Mortgage History
| Date | Status | Borrower | Loan Amount |
|---|---|---|---|
| Open | Sikkema Amber | $212,000 | |
| Closed | Sikkema Amber | $162,011 | |
| Previous Owner | Mccullough Erin | $123,954 |
Source: Public Records
Tax History Compared to Growth
Tax History
| Year | Tax Paid | Tax Assessment Tax Assessment Total Assessment is a certain percentage of the fair market value that is determined by local assessors to be the total taxable value of land and additions on the property. | Land | Improvement |
|---|---|---|---|---|
| 2025 | $3,829 | $163,500 | $0 | $0 |
| 2024 | $3,829 | $149,800 | $0 | $0 |
| 2023 | $3,959 | $136,100 | $0 | $0 |
| 2022 | $3,647 | $94,500 | $0 | $0 |
| 2021 | $3,561 | $88,100 | $0 | $0 |
| 2020 | $3,249 | $91,000 | $0 | $0 |
| 2019 | $3,483 | $85,100 | $0 | $0 |
| 2018 | $2,263 | $78,100 | $0 | $0 |
| 2017 | $2,205 | $65,600 | $0 | $0 |
| 2016 | $2,128 | $59,000 | $0 | $0 |
| 2015 | $2,104 | $59,000 | $0 | $0 |
| 2013 | -- | $54,100 | $0 | $0 |
Source: Public Records
Map
Nearby Homes
- 3414 Collingwood Ave SW
- 3257 Gladiola Ave SW
- 2330 Golden St SW
- 2435 Prairie St SW
- 3628 Wyoming Ave SW
- 1752 Plas St SW
- 2446 31st St SW
- 2412 30th St SW
- 2552 Prairie St SW
- 3715 Boone Ave SW
- 2866 West Ave SW
- 2945 Byron Center Ave SW Unit F
- 2925 Byron Center Ave SW Unit B
- 3806 Cook Ct SW
- 3540 Watergate Dr SW
- 3817 Taft Ave SW
- 2661 Stonebluff Dr SW
- 1525 Plas St SW
- 2745 Stonebluff Dr SW
- 2716 Byron Center Ave SW
- 3310 Perry Ave SW
- 3303 Perry Ave SW
- 3311 Sharon Ave SW
- 3318 Perry Ave SW
- 2073 Boone Ct SW
- 3311 Perry Ave SW
- 3303 Sharon Ave SW
- 3319 Perry Ave SW
- 3319 Sharon Ave SW
- 3326 Perry Ave SW
- 2065 Boone Ct SW
- 3327 Sharon Ave SW
- 3327 Perry Ave SW
- 3334 Perry Ave SW
- 2068 Boone Ct SW
- 3335 Sharon Ave SW
- 3335 Perry Ave SW
- 2057 Boone Ct SW
- 3305 Wyoming Ave SW
- 3318 Sharon Ave SW