Estimated Value: $224,788 - $264,000
--
Bed
2
Baths
1,468
Sq Ft
$165/Sq Ft
Est. Value
About This Home
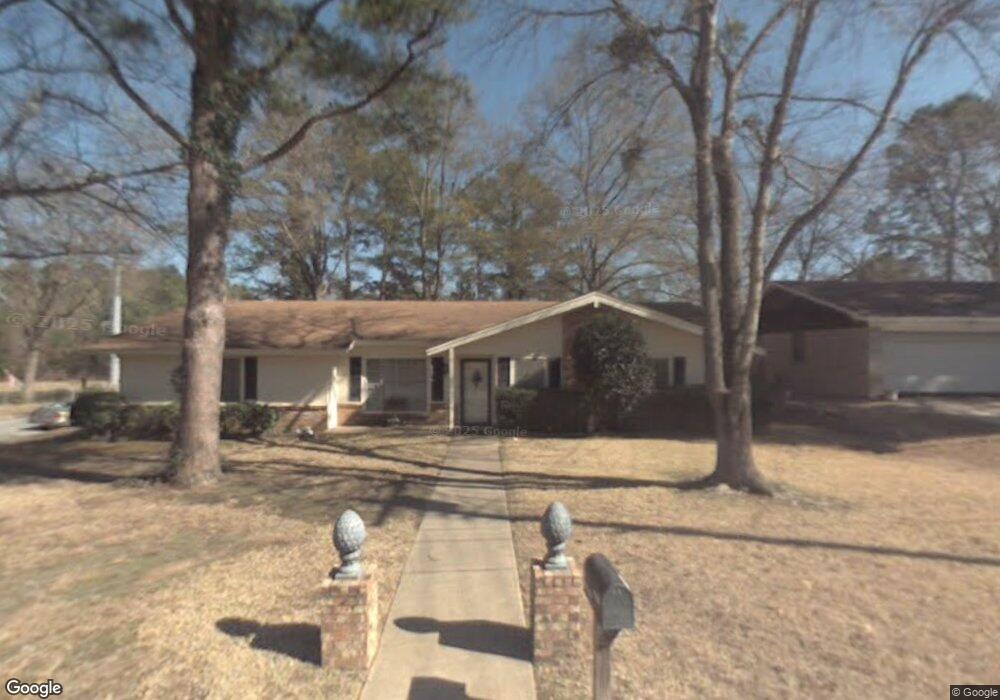
This home is located at 3302 Shenandoah Dr, Tyler, TX 75701 and is currently estimated at $242,197, approximately $164 per square foot. 3302 Shenandoah Dr is a home located in Smith County with nearby schools including Clarkston Elementary School, Hubbard Middle School, and Tyler Legacy High School.
Ownership History
Date
Name
Owned For
Owner Type
Purchase Details
Closed on
May 19, 2023
Sold by
Franzen John and Franzen Shannon
Bought by
3302 Shenandoah Series and Franzen Holdings Llc
Current Estimated Value
Purchase Details
Closed on
Jul 1, 2013
Sold by
Newberry Brad A and Newberry Katherine
Bought by
Starkweather Nicholas A
Home Financials for this Owner
Home Financials are based on the most recent Mortgage that was taken out on this home.
Original Mortgage
$117,826
Interest Rate
3.75%
Mortgage Type
FHA
Purchase Details
Closed on
Nov 1, 2012
Sold by
Deason Tommy Edwin and Deason Dorothy Stubbs
Bought by
Newberry Brad A and Newberry Katherine
Home Financials for this Owner
Home Financials are based on the most recent Mortgage that was taken out on this home.
Original Mortgage
$61,976
Interest Rate
3.52%
Mortgage Type
Purchase Money Mortgage
Create a Home Valuation Report for This Property
The Home Valuation Report is an in-depth analysis detailing your home's value as well as a comparison with similar homes in the area
Home Values in the Area
Average Home Value in this Area
Purchase History
| Date | Buyer | Sale Price | Title Company |
|---|---|---|---|
| 3302 Shenandoah Series | -- | None Listed On Document | |
| Starkweather Nicholas A | -- | None Available | |
| Newberry Brad A | -- | None Available |
Source: Public Records
Mortgage History
| Date | Status | Borrower | Loan Amount |
|---|---|---|---|
| Previous Owner | Starkweather Nicholas A | $117,826 | |
| Previous Owner | Newberry Brad A | $61,976 |
Source: Public Records
Tax History Compared to Growth
Tax History
| Year | Tax Paid | Tax Assessment Tax Assessment Total Assessment is a certain percentage of the fair market value that is determined by local assessors to be the total taxable value of land and additions on the property. | Land | Improvement |
|---|---|---|---|---|
| 2025 | $3,513 | $215,596 | $34,965 | $180,631 |
| 2024 | $3,513 | $206,499 | $23,670 | $182,829 |
| 2023 | $3,556 | $203,968 | $23,670 | $180,298 |
| 2022 | $3,087 | $157,545 | $23,670 | $133,875 |
| 2021 | $2,824 | $134,599 | $23,670 | $110,929 |
| 2020 | $2,861 | $133,704 | $23,670 | $110,034 |
| 2019 | $2,941 | $134,508 | $21,040 | $113,468 |
| 2018 | $2,630 | $120,942 | $18,016 | $102,926 |
| 2017 | $2,582 | $120,942 | $18,016 | $102,926 |
| 2016 | $2,548 | $119,335 | $18,016 | $101,319 |
| 2015 | $2,070 | $115,140 | $18,016 | $97,124 |
| 2014 | $2,070 | $97,400 | $18,016 | $79,384 |
Source: Public Records
Map
Nearby Homes
- 2827 Fairfax Dr
- 2631 Amy Ln
- 2958 Calloway Rd
- 2902 Shenandoah Dr
- 3107 Lake Vista Cir
- 3109 Campus Cir
- 3621 Rock Creek Dr
- 3108 Williamsburg Cir
- 2716 Roanoke Ln
- 2512 Alta Mira Dr
- 3308 Moss Glen
- 3801 Old Troup Hwy
- 2417 Riviera Dr
- 4004 Lazy Creek Dr
- 2523 Shenandoah Dr
- 2830 Juniper Ln
- 2509 Delmar Dr
- 4008 Pinecreek Dr
- 1920 McDonald Rd
- 3312 Storey Lake Dr
- 3302 3302 Shenandoah
- 3306 Shenandoah Dr
- 3310 Shenandoah Dr
- 3303 3303 Shenandoah
- 3214 Shenandoah Dr
- 3303 Shenandoah Dr
- 3307 Shenandoah Dr
- 3311 3311 Shenandoah Dr
- 3311 Shenandoah Dr
- 3316 Shenandoah Dr
- 3215 Shenandoah Dr
- 3210 Shenandoah Dr
- 2923 Amy Ln
- 3209 Shenandoah Dr
- 3342 Shenandoah Dr
- 2922 Lisa Ln
- 3325 Shenandoah Dr
- 3214 Rosemary Ln
- 3325 3325 Shenandoah Dr
- 3202 Shenandoah Dr