3303 36th Ave Long Island City, NY 11106
Astoria NeighborhoodEstimated Value: $3,836,302
--
Bed
--
Bath
4,600
Sq Ft
$834/Sq Ft
Est. Value
About This Home
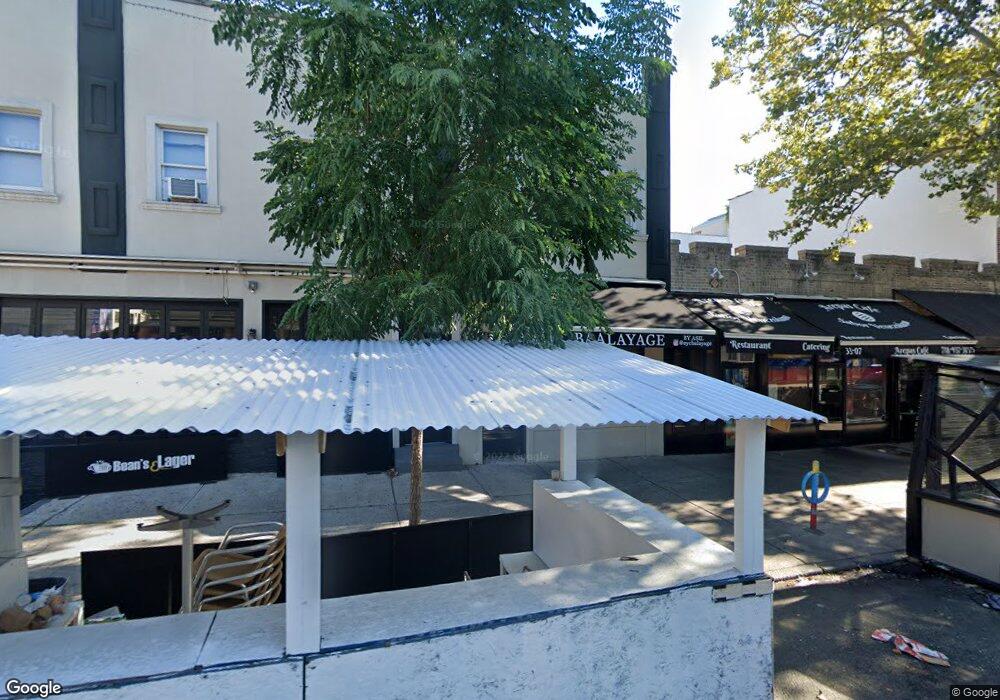
This home is located at 3303 36th Ave, Long Island City, NY 11106 and is currently estimated at $3,836,302, approximately $833 per square foot. 3303 36th Ave is a home located in Queens County with nearby schools including P.S. 166Q The Henry Gradstein School, I.S. 204 Oliver W. Holmes, and Long Island City High School.
Ownership History
Date
Name
Owned For
Owner Type
Purchase Details
Closed on
Aug 7, 2024
Sold by
3603 Management Corp
Bought by
Ralph R Realty Llc
Current Estimated Value
Purchase Details
Closed on
Sep 30, 2010
Sold by
National Property Services Inc
Bought by
3603 Management Corp
Home Financials for this Owner
Home Financials are based on the most recent Mortgage that was taken out on this home.
Original Mortgage
$600,000
Interest Rate
4.41%
Mortgage Type
Commercial
Purchase Details
Closed on
May 19, 2002
Sold by
Calos Lous and Calos Andy
Bought by
National Property Servic
Home Financials for this Owner
Home Financials are based on the most recent Mortgage that was taken out on this home.
Original Mortgage
$422,414
Interest Rate
6.58%
Mortgage Type
Commercial
Create a Home Valuation Report for This Property
The Home Valuation Report is an in-depth analysis detailing your home's value as well as a comparison with similar homes in the area
Home Values in the Area
Average Home Value in this Area
Purchase History
| Date | Buyer | Sale Price | Title Company |
|---|---|---|---|
| Ralph R Realty Llc | $3,700,000 | -- | |
| 3603 Management Corp | -- | -- | |
| 3603 Management Corp | -- | -- | |
| National Property Servic | -- | -- | |
| National Property Servic | -- | -- |
Source: Public Records
Mortgage History
| Date | Status | Borrower | Loan Amount |
|---|---|---|---|
| Previous Owner | 3603 Management Corp | $600,000 | |
| Previous Owner | National Property Servic | $422,414 |
Source: Public Records
Tax History Compared to Growth
Tax History
| Year | Tax Paid | Tax Assessment Tax Assessment Total Assessment is a certain percentage of the fair market value that is determined by local assessors to be the total taxable value of land and additions on the property. | Land | Improvement |
|---|---|---|---|---|
| 2025 | $44,032 | $422,100 | $99,900 | $322,200 |
| 2024 | $44,032 | $415,710 | $99,900 | $315,810 |
| 2023 | $41,944 | $396,000 | $99,900 | $296,100 |
| 2022 | $42,929 | $399,150 | $99,900 | $299,250 |
| 2021 | $37,488 | $350,550 | $99,900 | $250,650 |
| 2020 | $41,518 | $483,750 | $99,900 | $383,850 |
| 2019 | $37,753 | $386,550 | $99,900 | $286,650 |
| 2018 | $36,124 | $343,576 | $93,960 | $249,616 |
| 2017 | $34,338 | $326,597 | $91,980 | $234,617 |
| 2016 | $26,380 | $326,597 | $91,980 | $234,617 |
| 2015 | $15,411 | $228,508 | $90,000 | $138,508 |
| 2014 | $15,411 | $218,878 | $90,000 | $128,878 |
Source: Public Records
Map
Nearby Homes
- 36-11 31st St
- 36-09 31st St
- 35-34 31st St
- 36-44 32nd St
- 36-25 30th St Unit 1F
- 35-40 30th St Unit 1G
- 35-40 30th St Unit G
- 34-32 35th St Unit 3-F
- 35-55 29th St Unit 6J
- 35-55 29th St Unit 3D
- 37-14 34th St Unit N-3E
- 37-14 34th St Unit S4G
- 37-14 34th St Unit N-5E
- 37-34 33rd St Unit 7-I
- 37-34 33rd St Unit 4-K
- 37-34 33rd St Unit 7-E
- 37-34 33rd St Unit 7-F
- 37-34 33rd St Unit 3-K
- 37-26 32nd St Unit N-4G
- 3529 28th St
- 3553 33rd St
- 3311 36th Ave
- 3311 36th Ave
- 3551 33rd St
- 3313 36th Ave
- 35 W 33rd St Unit 17 A
- 35 W 33rd St Unit 21 A
- 35 W 33rd St Unit 8 E
- 35 W 33rd St Unit 14-A
- 35 W 33rd St Unit 29-C
- 35 W 33rd St Unit 16-D
- 35 W 33rd St Unit 6-E
- 35 W 33rd St Unit 11-B
- 35 W 33rd St Unit 22-A
- 35 W 33rd St Unit 35-B
- 35 W 33rd St Unit 25-C
- 35 W 33rd St Unit 32-A
- 35 W 33rd St Unit 7-E
- 35 W 33rd St Unit 25-F
- 35 W 33rd St Unit 15-E