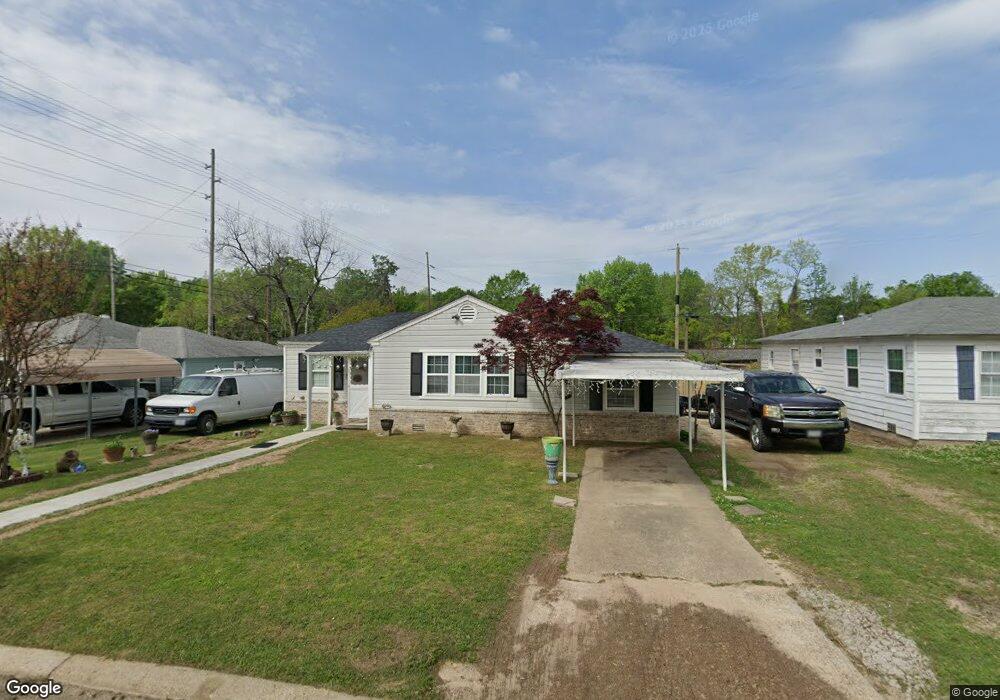
3303 Moore Dr Texarkana, TX 75503
Estimated Value: $92,452 - $109,000
--
Bed
--
Bath
1,266
Sq Ft
$79/Sq Ft
Est. Value
About This Home
This home is located at 3303 Moore Dr, Texarkana, TX 75503 and is currently estimated at $99,613, approximately $78 per square foot. 3303 Moore Dr is a home located in Bowie County with nearby schools including Highland Park Elementary School, Texas Middle School, and Texas High School.
Ownership History
Date
Name
Owned For
Owner Type
Purchase Details
Closed on
Nov 15, 2013
Sold by
Harrison Judith A
Bought by
Hernandez Maria
Current Estimated Value
Home Financials for this Owner
Home Financials are based on the most recent Mortgage that was taken out on this home.
Original Mortgage
$21,000
Interest Rate
4.29%
Mortgage Type
New Conventional
Purchase Details
Closed on
May 30, 2007
Sold by
Warren C E C and Warren Charlotte
Bought by
Salazar Maria
Home Financials for this Owner
Home Financials are based on the most recent Mortgage that was taken out on this home.
Original Mortgage
$35,931
Interest Rate
6.17%
Mortgage Type
FHA
Create a Home Valuation Report for This Property
The Home Valuation Report is an in-depth analysis detailing your home's value as well as a comparison with similar homes in the area
Home Values in the Area
Average Home Value in this Area
Purchase History
| Date | Buyer | Sale Price | Title Company |
|---|---|---|---|
| Hernandez Maria | -- | None Available | |
| Salazar Maria | -- | None Available |
Source: Public Records
Mortgage History
| Date | Status | Borrower | Loan Amount |
|---|---|---|---|
| Closed | Hernandez Maria | $21,000 | |
| Previous Owner | Salazar Maria | $35,931 |
Source: Public Records
Tax History Compared to Growth
Tax History
| Year | Tax Paid | Tax Assessment Tax Assessment Total Assessment is a certain percentage of the fair market value that is determined by local assessors to be the total taxable value of land and additions on the property. | Land | Improvement |
|---|---|---|---|---|
| 2025 | $711 | $68,235 | $6,500 | $61,735 |
| 2024 | $711 | $65,952 | $6,500 | $59,452 |
| 2023 | $1,461 | $61,696 | $6,500 | $55,196 |
| 2022 | $1,337 | $55,995 | $6,500 | $49,495 |
| 2021 | $1,294 | $50,619 | $6,500 | $44,119 |
| 2020 | $1,271 | $49,450 | $6,500 | $42,950 |
| 2019 | $1,267 | $47,496 | $6,500 | $40,996 |
| 2018 | $1,192 | $44,697 | $6,500 | $38,197 |
| 2017 | $1,169 | $43,962 | $6,500 | $37,462 |
| 2016 | $1,141 | $42,890 | $6,500 | $36,390 |
| 2015 | $1,145 | $42,539 | $6,500 | $36,039 |
| 2014 | $1,145 | $44,271 | $6,500 | $37,771 |
Source: Public Records
Map
Nearby Homes