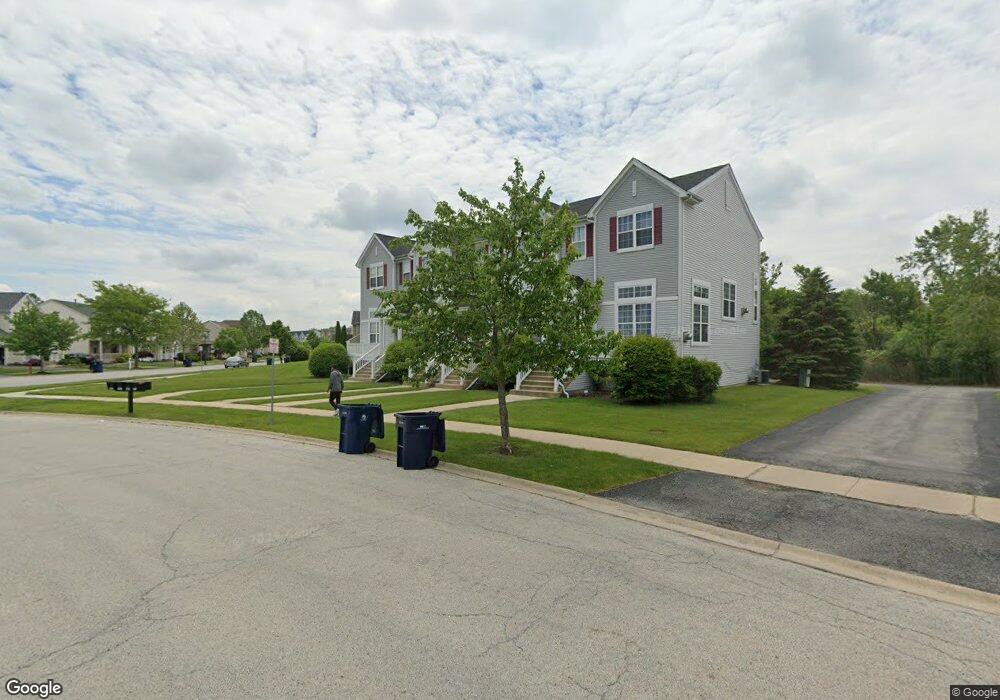
3303 Prairie St Unit 2 Matteson, IL 60443
Old Matteson NeighborhoodEstimated Value: $140,000 - $271,000
2
Beds
2
Baths
144,000
Sq Ft
$1/Sq Ft
Est. Value
About This Home
This home is located at 3303 Prairie St Unit 2, Matteson, IL 60443 and is currently estimated at $203,160, approximately $1 per square foot. 3303 Prairie St Unit 2 is a home located in Cook County with nearby schools including Illinois School, Indiana Elementary School, and Arcadia Elementary School.
Ownership History
Date
Name
Owned For
Owner Type
Purchase Details
Closed on
Dec 12, 2023
Sold by
Common Felecia and Common Robert
Bought by
Felecia Common Revocable Living Trust and Common
Current Estimated Value
Purchase Details
Closed on
Nov 4, 2018
Sold by
Common Robert
Bought by
Common Robert and Common Felecia
Purchase Details
Closed on
Apr 10, 2013
Sold by
Secretary Of Hud Of Washington Dc
Bought by
Common Robert
Home Financials for this Owner
Home Financials are based on the most recent Mortgage that was taken out on this home.
Original Mortgage
$58,404
Interest Rate
3.25%
Mortgage Type
FHA
Purchase Details
Closed on
Oct 30, 2012
Sold by
Brown Jennifer and Brown Jennifer M
Bought by
The Secretary Of Hud
Purchase Details
Closed on
Sep 1, 2005
Sold by
Bracken Darlene Y
Bought by
Burrell Gwendolyn
Home Financials for this Owner
Home Financials are based on the most recent Mortgage that was taken out on this home.
Original Mortgage
$164,900
Interest Rate
5.83%
Mortgage Type
FHA
Create a Home Valuation Report for This Property
The Home Valuation Report is an in-depth analysis detailing your home's value as well as a comparison with similar homes in the area
Home Values in the Area
Average Home Value in this Area
Purchase History
| Date | Buyer | Sale Price | Title Company |
|---|---|---|---|
| Felecia Common Revocable Living Trust | -- | None Listed On Document | |
| Common Robert | -- | Attorney | |
| Common Robert | -- | Chicago Title Insurance Comp | |
| The Secretary Of Hud | -- | None Available | |
| Burrell Gwendolyn | $170,000 | First American Title Ins Co |
Source: Public Records
Mortgage History
| Date | Status | Borrower | Loan Amount |
|---|---|---|---|
| Previous Owner | Common Robert | $58,404 | |
| Previous Owner | Burrell Gwendolyn | $164,900 |
Source: Public Records
Tax History Compared to Growth
Tax History
| Year | Tax Paid | Tax Assessment Tax Assessment Total Assessment is a certain percentage of the fair market value that is determined by local assessors to be the total taxable value of land and additions on the property. | Land | Improvement |
|---|---|---|---|---|
| 2024 | $5,528 | $16,692 | $2,567 | $14,125 |
| 2023 | $4,409 | $16,692 | $2,567 | $14,125 |
| 2022 | $4,409 | $11,548 | $1,451 | $10,097 |
| 2021 | $4,519 | $11,547 | $1,451 | $10,096 |
| 2020 | $4,301 | $11,547 | $1,451 | $10,096 |
| 2019 | $3,130 | $9,476 | $1,339 | $8,137 |
| 2018 | $3,126 | $9,476 | $1,339 | $8,137 |
| 2017 | $3,031 | $9,476 | $1,339 | $8,137 |
| 2016 | $3,328 | $9,266 | $1,227 | $8,039 |
| 2015 | $3,238 | $9,266 | $1,227 | $8,039 |
| 2014 | $3,163 | $9,266 | $1,227 | $8,039 |
| 2013 | $3,673 | $11,139 | $1,227 | $9,912 |
Source: Public Records
Map
Nearby Homes
- 21635 Dogwood Rd Unit 1165
- 338 Waldmann Dr
- 3133 Heritage Blvd
- 21607 Main St
- 356 Winnebago St
- 500 Antietam St
- 508 Davis St
- 549 Homan Ave
- 109 Walnut St
- 183 Washington St
- 116 Walnut St
- 315 Sheridan St
- 119 Willow St
- 182 Washington St
- 136 Willow St
- 3704 215th St Unit 205
- 191 Westwood Dr
- 3727 214th Place Unit 2
- 3704 Linden Rd
- 120 Indiana St
- 3303 Prairie St Unit 1262
- 3305 Prairie St Unit 1263
- 3305 Prairie St
- 3305 Prairie St Unit NONE
- 3301 Prairie St Unit 1261
- 3301 Prairie St Unit 126-1
- 3307 Prairie St Unit 1264
- 3309 Prairie St Unit 1251
- 3311 Prairie St Unit 1252
- 3313 Prairie St Unit 1253
- 3237 Holden Cir
- 3315 Prairie St Unit 1254
- 3315 Prairie St
- 3315 Prairie St Unit 3315
- 3315 Prairie St Unit 1254
- 3235 Holden Cir
- 3242 Holden Cir
- 3240 Holden Cir
- 3244 Holden Cir
- 3238 Holden Cir