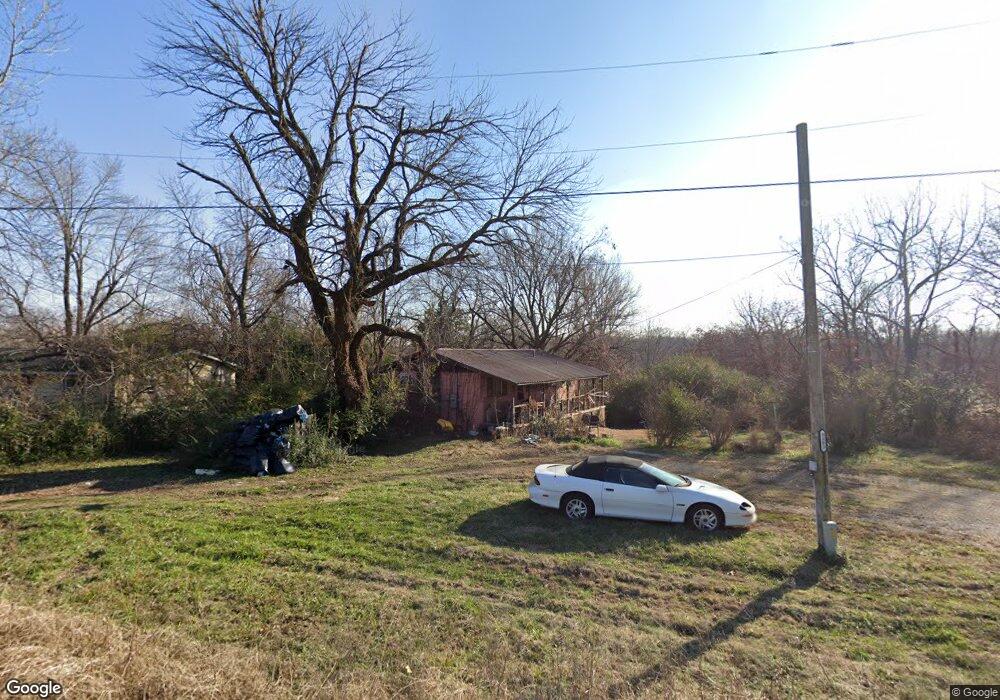
3303 S Mount Olive St Siloam Springs, AR 72761
Estimated Value: $149,671 - $224,000
--
Bed
2
Baths
720
Sq Ft
$251/Sq Ft
Est. Value
About This Home
This home is located at 3303 S Mount Olive St, Siloam Springs, AR 72761 and is currently estimated at $180,668, approximately $250 per square foot. 3303 S Mount Olive St is a home located in Benton County with nearby schools including Northside Elementary School, Southside Elementary School, and Delbert Pete & Pat Allen Elementary School.
Ownership History
Date
Name
Owned For
Owner Type
Purchase Details
Closed on
Sep 22, 1994
Bought by
Andrews Trust
Current Estimated Value
Purchase Details
Closed on
Jul 26, 1994
Bought by
Andrews
Purchase Details
Closed on
Jun 23, 1992
Bought by
Andrews
Purchase Details
Closed on
Jul 5, 1991
Bought by
Hud
Purchase Details
Closed on
Jun 4, 1991
Bought by
Fleet Mtg Corp
Purchase Details
Closed on
Jul 7, 1989
Bought by
Workman
Purchase Details
Closed on
Feb 24, 1987
Bought by
Webb 2 Lots
Purchase Details
Closed on
Jan 23, 1985
Bought by
Benton
Purchase Details
Closed on
Jan 10, 1985
Bought by
Pioneer France
Create a Home Valuation Report for This Property
The Home Valuation Report is an in-depth analysis detailing your home's value as well as a comparison with similar homes in the area
Home Values in the Area
Average Home Value in this Area
Purchase History
| Date | Buyer | Sale Price | Title Company |
|---|---|---|---|
| Andrews Trust | -- | -- | |
| Andrews | -- | -- | |
| Andrews | -- | -- | |
| Hud | -- | -- | |
| Fleet Mtg Corp | -- | -- | |
| Workman | -- | -- | |
| Webb 2 Lots | $81,000 | -- | |
| Benton | $19,000 | -- | |
| Pioneer France | $17,000 | -- |
Source: Public Records
Tax History Compared to Growth
Tax History
| Year | Tax Paid | Tax Assessment Tax Assessment Total Assessment is a certain percentage of the fair market value that is determined by local assessors to be the total taxable value of land and additions on the property. | Land | Improvement |
|---|---|---|---|---|
| 2025 | $1,036 | $28,431 | $7,400 | $21,031 |
| 2024 | $972 | $28,431 | $7,400 | $21,031 |
| 2023 | $883 | $20,280 | $5,600 | $14,680 |
| 2022 | $815 | $20,280 | $5,600 | $14,680 |
| 2021 | $746 | $20,280 | $5,600 | $14,680 |
| 2020 | $680 | $13,050 | $2,400 | $10,650 |
| 2019 | $680 | $13,050 | $2,400 | $10,650 |
| 2018 | $646 | $13,050 | $2,400 | $10,650 |
| 2017 | $547 | $13,050 | $2,400 | $10,650 |
| 2016 | $547 | $13,050 | $2,400 | $10,650 |
| 2015 | $497 | $9,540 | $1,600 | $7,940 |
| 2014 | $497 | $9,540 | $1,600 | $7,940 |
Source: Public Records
Map
Nearby Homes
- 2210 E Fennec St
- 0000 Elm St S
- 2711 Summitt Dr
- 2786 S Olive Ct
- 605 Roselawn St
- 2503 Chanel St
- 214 Lake Francis Dr
- 3210 S Lincoln St
- 3408 S Lincoln St
- 820 W Deer Lodge Ct
- 0 S Mount Olive St
- 419 W Hannibal St
- 1413 E Emelyn Ln
- 506 W Quarter Rd
- 17900 Crestwood Dr
- 412 W Kenwood St
- 926 S Elm St
- 22624 Marsh Rd
- 22024 Brooks Rd
- 0 Tbd Hwy 412 W
- 110 Lacy St
- 3301 S Mount Olive St
- 3312 S Dogwood St
- 3301 S Dogwood St
- 115 Lacy St
- 3316 S Dogwood St
- 3201 Mt Olive St
- 119 Lacy St
- 3201 S Mount Olive St
- 110 Kane St
- 118 Kane St
- 3300 S Redbud Dr
- 3308 S Redbud Dr
- 203 Lacy St
- 126 Kane St
- 3316 S Redbud Dr
- 209 Lacy St
- 200 Kane St
- 3602 N Scarlet Ln
- 3604 N Scarlet Ln