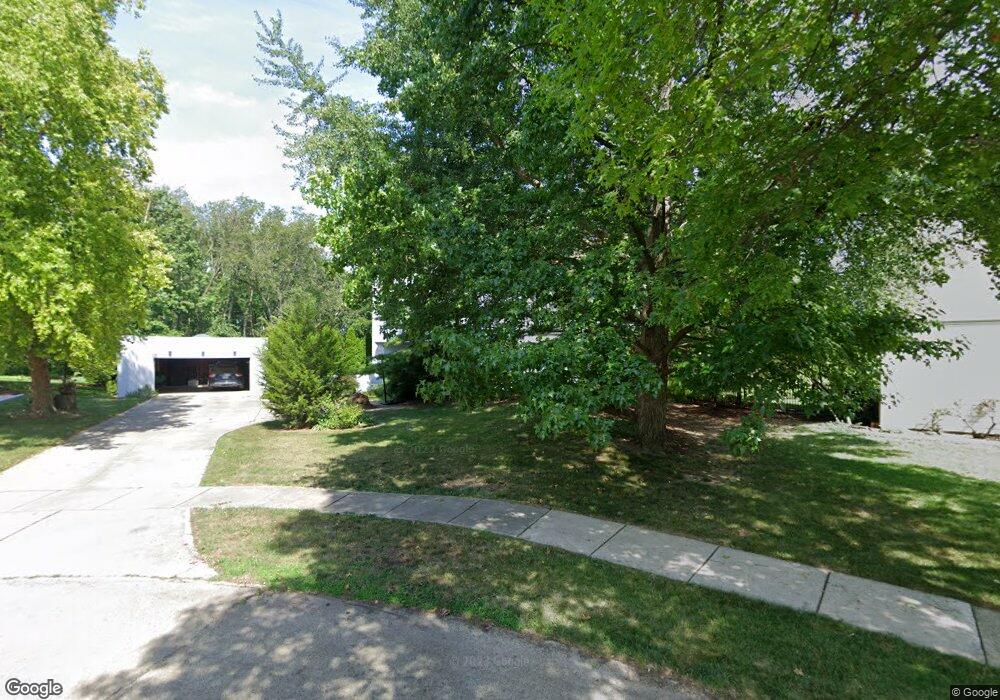
3303 S Pine Cir Unit 1 Urbana, IL 61802
Estimated Value: $598,876 - $710,000
4
Beds
4
Baths
1,867
Sq Ft
$353/Sq Ft
Est. Value
About This Home
This home is located at 3303 S Pine Cir Unit 1, Urbana, IL 61802 and is currently estimated at $658,625, approximately $352 per square foot. 3303 S Pine Cir Unit 1 is a home located in Champaign County with nearby schools including Wiley Elementary School, Urbana Middle School, and Urbana High School.
Ownership History
Date
Name
Owned For
Owner Type
Purchase Details
Closed on
Dec 10, 2013
Sold by
Schloer Wolfgang F and Hastings Laura A
Bought by
Aksimentiev Oleksii and Aksimentyeva Anzhela
Current Estimated Value
Home Financials for this Owner
Home Financials are based on the most recent Mortgage that was taken out on this home.
Original Mortgage
$408,750
Outstanding Balance
$305,030
Interest Rate
4.17%
Mortgage Type
New Conventional
Estimated Equity
$353,595
Purchase Details
Closed on
Jul 26, 2007
Sold by
Mackin Thomas J and Jovanovic Jasna D
Bought by
Schloer Wolfgang F and Hastings Laura A
Home Financials for this Owner
Home Financials are based on the most recent Mortgage that was taken out on this home.
Original Mortgage
$417,000
Interest Rate
6.73%
Mortgage Type
Purchase Money Mortgage
Create a Home Valuation Report for This Property
The Home Valuation Report is an in-depth analysis detailing your home's value as well as a comparison with similar homes in the area
Home Values in the Area
Average Home Value in this Area
Purchase History
| Date | Buyer | Sale Price | Title Company |
|---|---|---|---|
| Aksimentiev Oleksii | $545,000 | None Available | |
| Schloer Wolfgang F | $525,000 | Downstate Title |
Source: Public Records
Mortgage History
| Date | Status | Borrower | Loan Amount |
|---|---|---|---|
| Open | Aksimentiev Oleksii | $408,750 | |
| Previous Owner | Schloer Wolfgang F | $417,000 |
Source: Public Records
Tax History Compared to Growth
Tax History
| Year | Tax Paid | Tax Assessment Tax Assessment Total Assessment is a certain percentage of the fair market value that is determined by local assessors to be the total taxable value of land and additions on the property. | Land | Improvement |
|---|---|---|---|---|
| 2024 | $12,957 | $174,450 | $27,240 | $147,210 |
| 2023 | $12,957 | $165,040 | $25,770 | $139,270 |
| 2022 | $12,047 | $150,580 | $23,510 | $127,070 |
| 2021 | $11,385 | $142,590 | $22,260 | $120,330 |
| 2020 | $10,834 | $136,060 | $21,240 | $114,820 |
| 2019 | $10,538 | $136,060 | $21,240 | $114,820 |
| 2018 | $10,190 | $132,610 | $20,700 | $111,910 |
| 2017 | $10,377 | $129,750 | $20,250 | $109,500 |
| 2016 | $10,028 | $126,220 | $19,700 | $106,520 |
| 2015 | $9,900 | $123,260 | $19,240 | $104,020 |
| 2014 | $10,044 | $127,470 | $19,900 | $107,570 |
| 2013 | $10,411 | $134,460 | $20,990 | $113,470 |
Source: Public Records
Map
Nearby Homes
- 2509 S Lynn St
- 805 Shurts St
- 3310 Melissa Ln
- 2305 E Shurts Cir
- 2810 Philo Rd
- 114 W Mchenry St Unit A
- 1606 E Marc Trail
- 1606 E Horizon Ln
- 401 E Holmes St
- 1609 E Horizon Ln
- 1003 E Mchenry St
- 2730 Philo Rd
- 3405 Memory Ln
- 1806 Trails Dr
- 2902 S Myra Ridge Dr
- 2208 Fletcher St
- 2015 Cureton Dr
- 2015 Cureton Dr Unit B
- 2015 Cureton Dr Unit A
- 1905 Plains Ct
- 3303 S Pine Cir
- 3305 S Pine Cir
- 3307 S Pine Cir
- 3304 S Pine Cir
- 3306 S Pine Cir
- 304 E Sherwin Dr
- 3309 S Pine Cir
- 3302 S Pine Cir
- 402 E Sherwin Dr
- 302 E Sherwin Dr
- 302 E Sherwin Dr
- 303 E Sherwin Dr Unit 1
- 406 E Oakbrook Cir
- 301 E Sherwin Dr
- 309 E Sherwin Dr
- 309 E Sherwin Dr Unit 1
- 407 E Oakbrook Cir
- 406 E Sherwin Dr
- 403 E Sherwin Dr
- 306 E Sherwin Cir