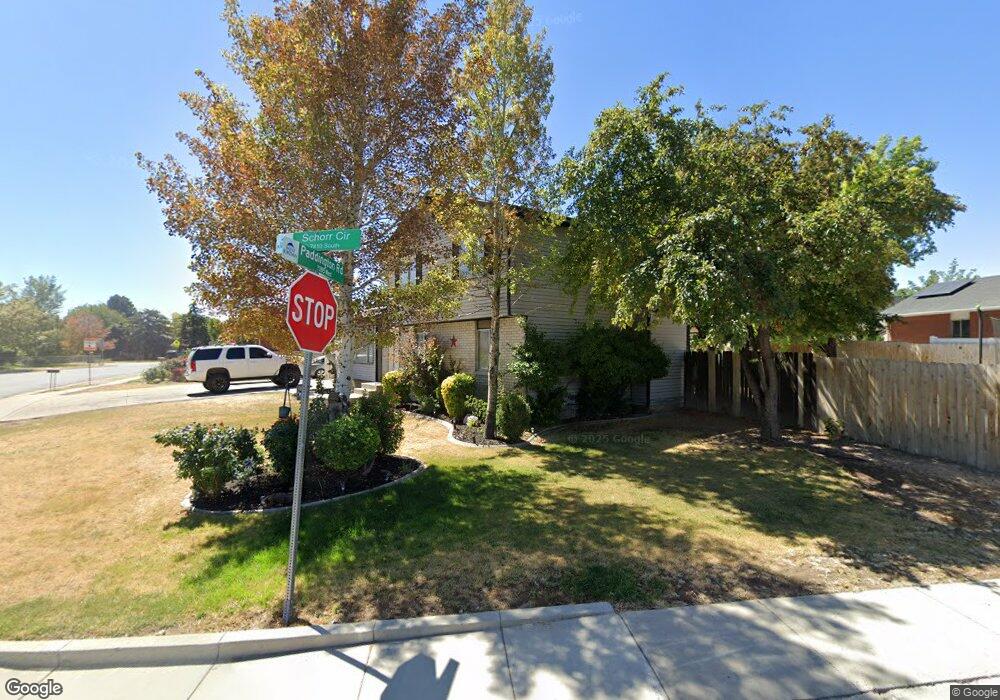
3303 W Schorr Cir West Jordan, UT 84084
Estimated Value: $504,000 - $552,000
5
Beds
3
Baths
2,176
Sq Ft
$245/Sq Ft
Est. Value
About This Home
This home is located at 3303 W Schorr Cir, West Jordan, UT 84084 and is currently estimated at $534,019, approximately $245 per square foot. 3303 W Schorr Cir is a home located in Salt Lake County with nearby schools including Oquirrh Elementary School, Joel P. Jensen Middle School, and West Jordan High School.
Ownership History
Date
Name
Owned For
Owner Type
Purchase Details
Closed on
May 1, 2020
Sold by
Dyer Lisa
Bought by
Ellis Cameron J
Current Estimated Value
Home Financials for this Owner
Home Financials are based on the most recent Mortgage that was taken out on this home.
Original Mortgage
$247,252
Outstanding Balance
$220,318
Interest Rate
3.6%
Mortgage Type
VA
Estimated Equity
$313,701
Purchase Details
Closed on
Feb 10, 2004
Sold by
Ellis Lisa W and Woolf Barbara S
Bought by
Dyer Lisa
Home Financials for this Owner
Home Financials are based on the most recent Mortgage that was taken out on this home.
Original Mortgage
$128,000
Interest Rate
5.82%
Mortgage Type
Unknown
Purchase Details
Closed on
Jul 28, 1998
Sold by
Ellis Lisa W
Bought by
Ellis Lisa W and Woolf Barbara S
Home Financials for this Owner
Home Financials are based on the most recent Mortgage that was taken out on this home.
Original Mortgage
$134,000
Interest Rate
6.9%
Create a Home Valuation Report for This Property
The Home Valuation Report is an in-depth analysis detailing your home's value as well as a comparison with similar homes in the area
Home Values in the Area
Average Home Value in this Area
Purchase History
| Date | Buyer | Sale Price | Title Company |
|---|---|---|---|
| Ellis Cameron J | -- | Vanguard Title Union Park | |
| Dyer Lisa | -- | Backman Stewart Title Svcs | |
| Ellis Lisa W | -- | -- | |
| Ellis Lisa W | -- | -- |
Source: Public Records
Mortgage History
| Date | Status | Borrower | Loan Amount |
|---|---|---|---|
| Open | Ellis Cameron J | $247,252 | |
| Previous Owner | Dyer Lisa | $128,000 | |
| Previous Owner | Ellis Lisa W | $134,000 |
Source: Public Records
Tax History Compared to Growth
Tax History
| Year | Tax Paid | Tax Assessment Tax Assessment Total Assessment is a certain percentage of the fair market value that is determined by local assessors to be the total taxable value of land and additions on the property. | Land | Improvement |
|---|---|---|---|---|
| 2025 | $2,501 | $499,200 | $128,600 | $370,600 |
| 2024 | $2,501 | $481,200 | $124,300 | $356,900 |
| 2023 | $2,404 | $436,000 | $119,500 | $316,500 |
| 2022 | $2,495 | $445,100 | $117,200 | $327,900 |
| 2021 | $2,105 | $341,800 | $92,700 | $249,100 |
| 2020 | $1,913 | $291,500 | $86,600 | $204,900 |
| 2019 | $1,922 | $287,300 | $86,600 | $200,700 |
| 2018 | $1,735 | $257,200 | $81,800 | $175,400 |
| 2017 | $1,615 | $238,400 | $81,800 | $156,600 |
| 2016 | $1,591 | $220,600 | $81,800 | $138,800 |
| 2015 | $1,609 | $217,500 | $83,400 | $134,100 |
| 2014 | $1,545 | $205,700 | $79,500 | $126,200 |
Source: Public Records
Map
Nearby Homes
- 7611 S Springbrook Dr
- 7604 S Autumn Dr
- 3422 Briar Dr
- 3354 W 7800 S
- 3165 W 7720 S
- 2886 W 7550 S
- 7122 S Wood Green Rd
- 7721 Sunset Cir
- 3476 W Spaulding Rd
- 3066 W Linton Dr
- 3629 W 7825 S
- 7642 S 2700 W
- 3647 W 7865 S
- 6980 S 3535 W Unit 2
- 8524 S Michele River Ave W Unit 109
- 7361 S 2700 W
- 6968 S 3535 W Unit 3
- 3546 W 7980 S
- 6893 S 3200 W
- 3383 W 6880 S
- 3303 Schorr Cir
- 7438 Paddington Rd
- 3317 Schorr Cir
- 3308 Charing Cross Rd
- 7415 Paddington Rd
- 7405 Paddington Rd
- 3324 Charing Cross Rd
- 3324 W Charing Cross Rd
- 3320 Schorr Cir
- 7395 S Paddington Rd
- 7437 S 3285 W
- 7437 Paddington Rd
- 3331 Schorr Cir
- 3331 W Schorr Cir
- 7385 S Paddington Rd
- 7385 Paddington Rd
- 7458 Paddington Cir
- 3338 Charing Cross Rd
- 3338 W Charing Cross Rd
- 3334 Schorr Cir