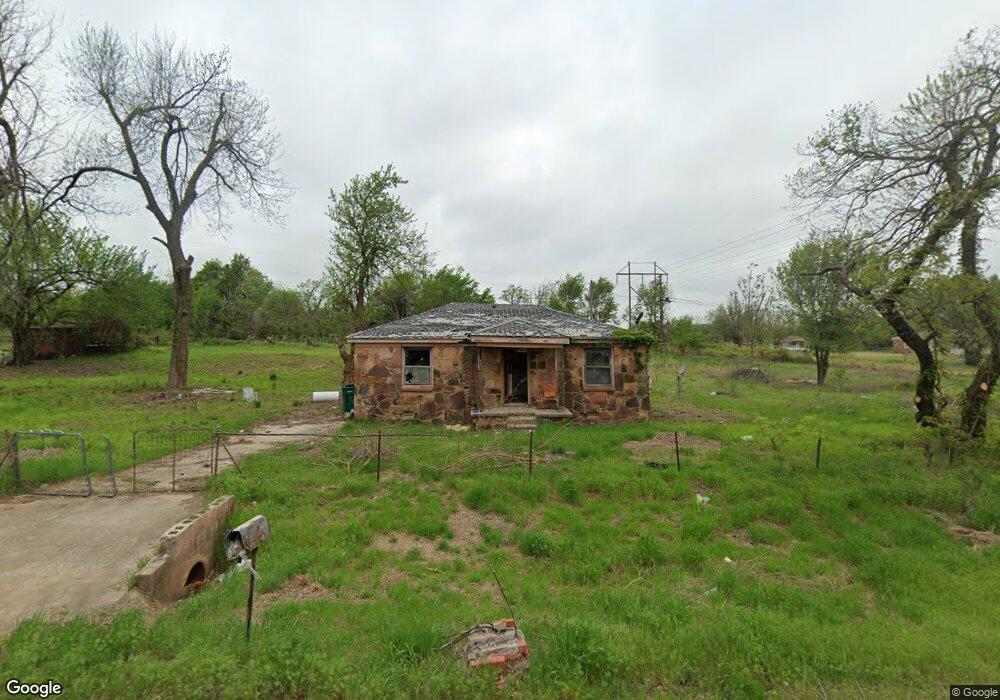
3304 Hicks Ave Spencer, OK 73084
Estimated Value: $67,470 - $151,000
2
Beds
1
Bath
805
Sq Ft
$114/Sq Ft
Est. Value
About This Home
This home is located at 3304 Hicks Ave, Spencer, OK 73084 and is currently estimated at $92,118, approximately $114 per square foot. 3304 Hicks Ave is a home located in Oklahoma County with nearby schools including Willow Brook Elementary School and Star Spencer Mid-High School.
Ownership History
Date
Name
Owned For
Owner Type
Purchase Details
Closed on
Nov 19, 2025
Sold by
Maldonado Ceferino
Bought by
Bailon Evelio Rolando Vasq
Current Estimated Value
Purchase Details
Closed on
Jan 15, 2025
Sold by
Kb & Rebo Properties Llc
Bought by
Maldonado Ceferino
Purchase Details
Closed on
Aug 27, 2024
Sold by
James Gwendolyn Joyce and Egj Revocable Trust
Bought by
Kb & Rebo Properties Llc
Purchase Details
Closed on
Dec 22, 2023
Sold by
Ogle Property Solutions Llc
Bought by
Kb & Rebo Properties Llc
Purchase Details
Closed on
Dec 18, 2023
Sold by
James Carla
Bought by
Ogle Property Solutions Llc
Purchase Details
Closed on
Apr 13, 2019
Sold by
Egj Revocable Trust and James Earl Wallace
Bought by
Not Given
Purchase Details
Closed on
Apr 21, 2015
Sold by
James Earl W
Bought by
James Earl W and James Gwendolyn J
Purchase Details
Closed on
May 15, 2012
Sold by
James Bernice M
Bought by
James Bernice M and James Earl W
Create a Home Valuation Report for This Property
The Home Valuation Report is an in-depth analysis detailing your home's value as well as a comparison with similar homes in the area
Home Values in the Area
Average Home Value in this Area
Purchase History
| Date | Buyer | Sale Price | Title Company |
|---|---|---|---|
| Bailon Evelio Rolando Vasq | $20,000 | None Listed On Document | |
| Maldonado Ceferino | $18,000 | None Listed On Document | |
| Maldonado Ceferino | $18,000 | None Listed On Document | |
| Kb & Rebo Properties Llc | -- | None Listed On Document | |
| Kb & Rebo Properties Llc | $15,000 | Chicago Title | |
| Ogle Property Solutions Llc | $10,000 | None Listed On Document | |
| Not Given | -- | None Listed On Document | |
| James Earl W | -- | None Available | |
| James Bernice M | -- | None Available |
Source: Public Records
Tax History
| Year | Tax Paid | Tax Assessment Tax Assessment Total Assessment is a certain percentage of the fair market value that is determined by local assessors to be the total taxable value of land and additions on the property. | Land | Improvement |
|---|---|---|---|---|
| 2025 | $333 | $5,610 | $355 | $5,255 |
| 2024 | $314 | $3,055 | $217 | $2,838 |
| 2023 | $314 | $2,910 | $244 | $2,666 |
| 2022 | $283 | $2,772 | $230 | $2,542 |
| 2021 | $272 | $2,640 | $258 | $2,382 |
| 2020 | $280 | $2,695 | $258 | $2,437 |
| 2019 | $296 | $2,860 | $258 | $2,602 |
| 2018 | $291 | $2,970 | $0 | $0 |
| 2017 | $291 | $2,969 | $258 | $2,711 |
| 2016 | $293 | $2,969 | $258 | $2,711 |
| 2015 | $286 | $2,890 | $258 | $2,632 |
| 2014 | $289 | $2,933 | $258 | $2,675 |
Source: Public Records
Map
Nearby Homes
- 3105 Wright Ave
- 3100 Hicks Ave
- 9720 NE 29th St
- 0 NE 36th St
- 0 NE 36th Lenox Unit OKC1219123
- 9632 NE 23rd St
- 9715 NE 42nd St
- 1915 N Avery Ave
- 3500 N Westminster Rd
- 2201 N Saint Luke Ave
- 1800 David Terrace
- 2104 N Saint Luke Ave
- 4401 Bosworth Ave
- 3736 N Westminster Rd
- 1701 N Post Rd
- 9909 Lloyd Dr
- 10014 Caton Place
- 10015 Isaac Dr
- 11027 Jeffords Ave
- 2222 N Douglas Blvd
Your Personal Tour Guide
Ask me questions while you tour the home.