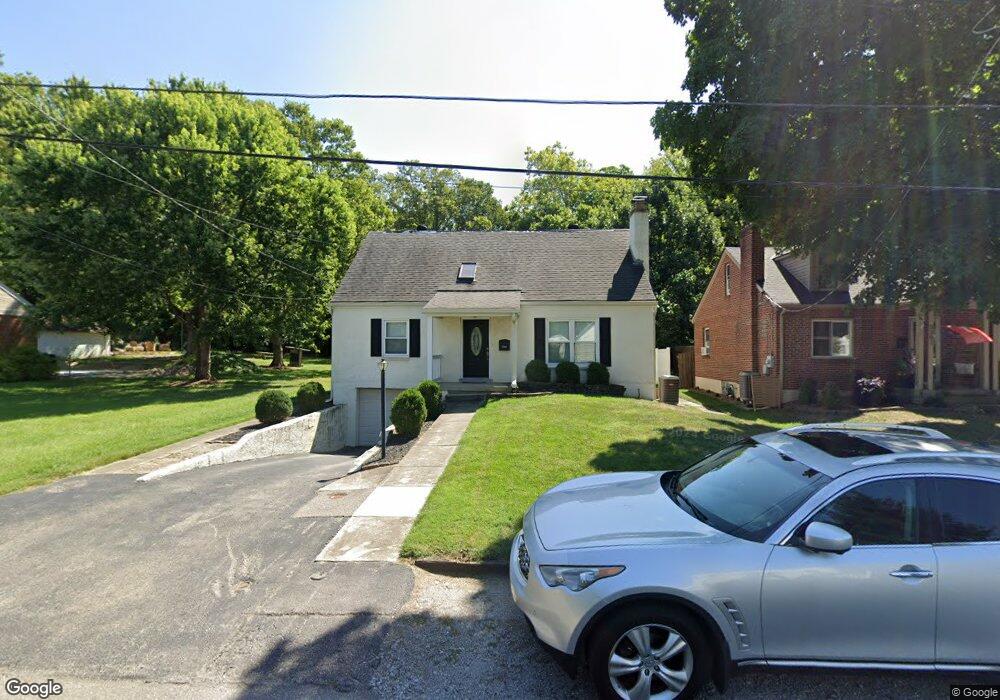
3304 Pine St Cincinnati, OH 45244
Estimated Value: $236,970 - $274,000
3
Beds
2
Baths
1,708
Sq Ft
$149/Sq Ft
Est. Value
About This Home
This home is located at 3304 Pine St, Cincinnati, OH 45244 and is currently estimated at $254,743, approximately $149 per square foot. 3304 Pine St is a home located in Hamilton County with nearby schools including Mercer Elementary School, Nagel Middle School, and Turpin High School.
Ownership History
Date
Name
Owned For
Owner Type
Purchase Details
Closed on
Aug 22, 2008
Sold by
Walker Scott R and Walker Mary A
Bought by
Papes Richard A
Current Estimated Value
Home Financials for this Owner
Home Financials are based on the most recent Mortgage that was taken out on this home.
Original Mortgage
$62,000
Outstanding Balance
$40,664
Interest Rate
6.66%
Mortgage Type
Unknown
Estimated Equity
$214,079
Purchase Details
Closed on
Apr 13, 2007
Sold by
Bowman Stephanie K and Bowman Douglas R
Bought by
Walker Scott R and Walker Mary A
Home Financials for this Owner
Home Financials are based on the most recent Mortgage that was taken out on this home.
Original Mortgage
$118,150
Interest Rate
6.75%
Mortgage Type
Unknown
Purchase Details
Closed on
Mar 30, 2001
Sold by
Mcleod Dennis M and Mcleod Cheri D
Bought by
Bowman Douglas R and Brown Stephanie K
Home Financials for this Owner
Home Financials are based on the most recent Mortgage that was taken out on this home.
Original Mortgage
$128,385
Interest Rate
7.05%
Mortgage Type
FHA
Create a Home Valuation Report for This Property
The Home Valuation Report is an in-depth analysis detailing your home's value as well as a comparison with similar homes in the area
Home Values in the Area
Average Home Value in this Area
Purchase History
| Date | Buyer | Sale Price | Title Company |
|---|---|---|---|
| Papes Richard A | $135,000 | Advanced Land Title Agency | |
| Walker Scott R | $139,000 | Reliable Land Title Agency L | |
| Bowman Douglas R | $130,400 | -- |
Source: Public Records
Mortgage History
| Date | Status | Borrower | Loan Amount |
|---|---|---|---|
| Open | Papes Richard A | $62,000 | |
| Previous Owner | Walker Scott R | $118,150 | |
| Previous Owner | Bowman Douglas R | $128,385 |
Source: Public Records
Tax History
| Year | Tax Paid | Tax Assessment Tax Assessment Total Assessment is a certain percentage of the fair market value that is determined by local assessors to be the total taxable value of land and additions on the property. | Land | Improvement |
|---|---|---|---|---|
| 2025 | $2,957 | $52,095 | $9,811 | $42,284 |
| 2024 | $2,900 | $52,095 | $9,811 | $42,284 |
| 2023 | $2,914 | $52,095 | $9,811 | $42,284 |
| 2022 | $2,620 | $41,769 | $8,974 | $32,795 |
| 2021 | $2,551 | $41,769 | $8,974 | $32,795 |
| 2020 | $2,584 | $41,769 | $8,974 | $32,795 |
| 2019 | $2,572 | $37,972 | $8,159 | $29,813 |
| 2018 | $2,402 | $37,972 | $8,159 | $29,813 |
| 2017 | $2,279 | $37,972 | $8,159 | $29,813 |
| 2016 | $2,565 | $41,741 | $7,847 | $33,894 |
| 2015 | $2,647 | $41,741 | $7,847 | $33,894 |
| 2014 | $2,650 | $41,741 | $7,847 | $33,894 |
| 2013 | $2,469 | $41,328 | $7,770 | $33,558 |
Source: Public Records
Map
Nearby Homes
- 3226 Church St
- 3379 Rio Grande Ln
- 6809 Jefferson St
- 7260 English Dr Unit 8303
- 6716 Treeridge Dr
- 6939 Treeridge Dr
- 7269 Anderson Woods Dr
- 2631 Newtown Rd
- 7721 Pine Isle Ct
- 2559 Concordgreen Dr
- 7481 Heatherwood Ln
- 2560 Coveyrun Ct
- 6420 Copperleaf Ln
- 3746 Miami Run
- 3767 Miami Run
- 3750 Miami Run
- 3758 Miami Run
- 3771 Miami Run
- 3754 Miami Run
- 3762 Miami Run
Your Personal Tour Guide
Ask me questions while you tour the home.