3304 Teeside Dr Unit 1 New Port Richey, FL 34655
Estimated Value: $175,342 - $214,000
2
Beds
2
Baths
1,304
Sq Ft
$147/Sq Ft
Est. Value
About This Home
This home is located at 3304 Teeside Dr Unit 1, New Port Richey, FL 34655 and is currently estimated at $191,336, approximately $146 per square foot. 3304 Teeside Dr Unit 1 is a home located in Pasco County with nearby schools including Longleaf Elementary School, Seven Springs Middle School, and James W. Mitchell High School.
Ownership History
Date
Name
Owned For
Owner Type
Purchase Details
Closed on
Jun 12, 2017
Sold by
Przeoiora Theresa E
Bought by
Lawson Mark and Griffo Deborah
Current Estimated Value
Purchase Details
Closed on
Jun 9, 2017
Sold by
Myrick Barbara A
Bought by
Lawson Mark and Griffo Deborah
Purchase Details
Closed on
Jun 8, 2017
Sold by
Davis James W
Bought by
Lawson Mark and Griffo Deborah
Purchase Details
Closed on
Apr 4, 2014
Sold by
Brown Alan J and Mary Brown H
Bought by
Kolodziejczyk Michael T and Kolodziejezyk Nancy R
Purchase Details
Closed on
Mar 17, 2011
Sold by
Campbell Joseph S and Campbell David L
Bought by
Brown Alan J and Mary Brown H
Purchase Details
Closed on
Feb 2, 2011
Sold by
Campbell Joseph S and Campbell David Lee
Bought by
Campbell Joseph S and Campbell David Lee
Purchase Details
Closed on
Jun 28, 2007
Sold by
Flood Alma S
Bought by
Flood Alma S
Create a Home Valuation Report for This Property
The Home Valuation Report is an in-depth analysis detailing your home's value as well as a comparison with similar homes in the area
Home Values in the Area
Average Home Value in this Area
Purchase History
| Date | Buyer | Sale Price | Title Company |
|---|---|---|---|
| Lawson Mark | -- | Master Title Services Inc | |
| Lawson Mark | $55,000 | Master Title Services Inc | |
| Lawson Mark | -- | Master Title Svcs Inc | |
| Lawson Mark | -- | Master Title Service Inc | |
| Lawson Mark | -- | Master Title Services Inc | |
| Kolodziejczyk Michael T | $62,500 | 1St Affiliated Title Service | |
| Brown Alan J | $52,500 | 1St Affiliated Title Service | |
| Campbell Joseph S | -- | Attorney | |
| Flood Alma S | -- | Attorney |
Source: Public Records
Tax History Compared to Growth
Tax History
| Year | Tax Paid | Tax Assessment Tax Assessment Total Assessment is a certain percentage of the fair market value that is determined by local assessors to be the total taxable value of land and additions on the property. | Land | Improvement |
|---|---|---|---|---|
| 2025 | $2,370 | $166,823 | $5,059 | $161,764 |
| 2024 | $2,370 | $157,480 | $5,059 | $152,421 |
| 2023 | $2,175 | $102,440 | $0 | $0 |
| 2022 | $1,747 | $114,715 | $5,059 | $109,656 |
| 2021 | $1,638 | $106,633 | $5,059 | $101,574 |
| 2020 | $1,413 | $81,954 | $5,059 | $76,895 |
| 2019 | $1,279 | $69,989 | $5,059 | $64,930 |
| 2018 | $1,296 | $71,086 | $5,059 | $66,027 |
| 2017 | $1,055 | $55,126 | $5,059 | $50,067 |
| 2016 | $461 | $46,777 | $0 | $0 |
| 2015 | $463 | $46,452 | $0 | $0 |
| 2014 | $970 | $52,072 | $5,059 | $47,013 |
Source: Public Records
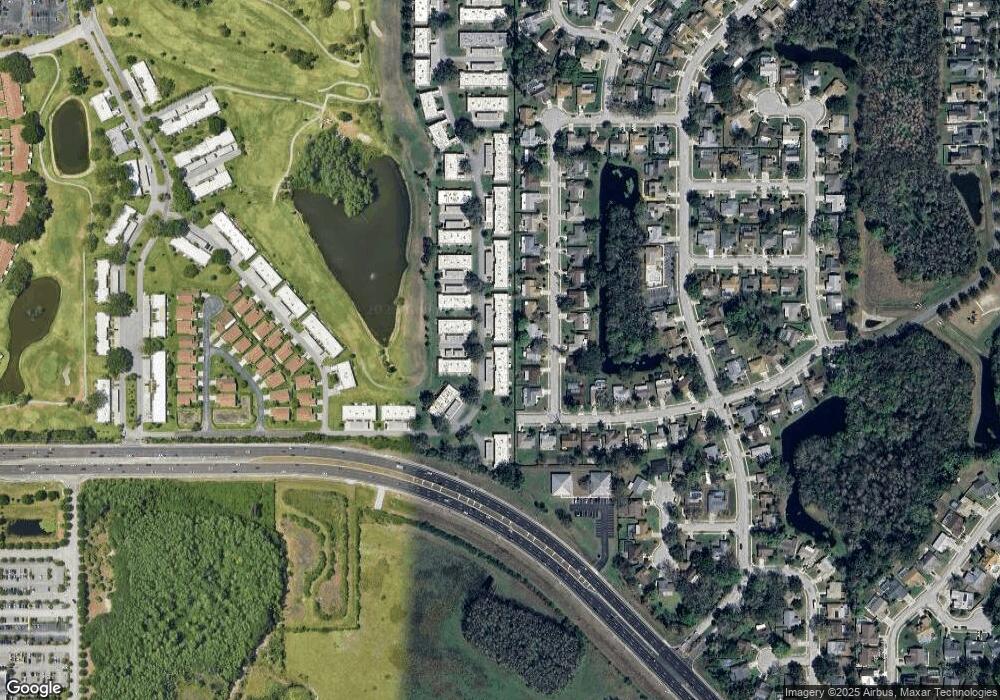
Map
Nearby Homes
- 3411 Teeside Dr
- 3402 Rankin Dr
- 9827 Lema Ct
- 3503 Teeside Dr
- 3521 Teeside Dr Unit 3521
- 3422 Trophy Blvd
- 3248 Trophy Blvd
- 3516 Player Dr
- 3125 Ellington Way
- 3103 Ellington Way
- 9344 Links Ln Unit 3905
- 3602 Player Dr
- 3310 Lori Ln
- 3716 Trophy Blvd
- 10127 Ringling St
- 3712 Trophy Blvd Unit 3712
- 3683 Trophy Blvd Unit 7
- 3450 Ferrell St
- 3716 Player Dr
- 9622 Brassie Ct Unit 9
- 3302 Teeside Dr Unit 2302
- 3300 Teeside Dr
- 3314 Teeside Dr
- 3233 Teeside Dr Unit 6602
- 3250 Teeside Dr Unit 2306
- 3254 Teeside Dr
- 3230 Teeside Dr
- 3232 Teeside Dr
- 3229 Teeside Dr Unit 6604
- 3254 Teeside Dr Unit 4
- 3316 Teeside Dr
- 3316 Teeside Dr Unit 3316
- 3252 Teeside Dr
- 3305 Rankin Dr
- 3318 Teeside Dr Unit 2210
- 3311 Rankin Dr
- 3307 Teeside Dr Unit 4
- 3307 Teeside Dr
- 3241 Rankin Dr
- 3320 Teeside Dr Unit 9