3305 G St Merced, CA 95340
North Merced NeighborhoodEstimated Value: $1,432,037
About This Home
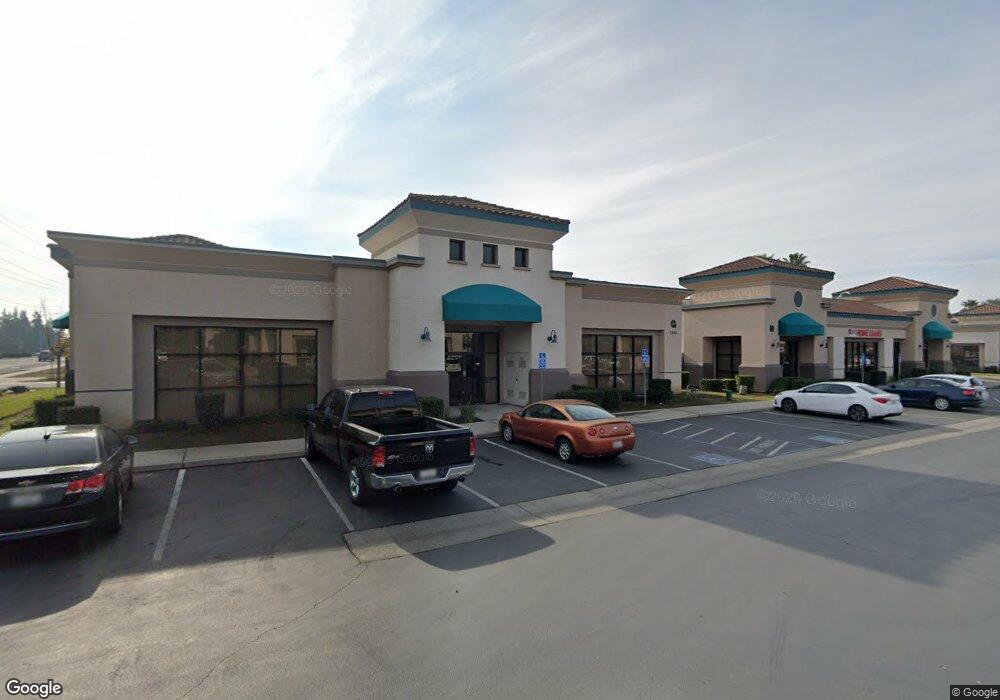
This home is located at 3305 G St, Merced, CA 95340 and is currently estimated at $1,432,037, approximately $279 per square foot. 3305 G St is a home located in Merced County with nearby schools including Allan Peterson Elementary School, Herbert H. Cruickshank Middle School, and Merced High School.
Ownership History
We collect this data history from publicly available records. To have your information removed, we recommend requesting removal directly through your county’s website.
Purchase Details
Purchase Details
Home Financials for this Owner
Home Financials are based on the most recent Mortgage that was taken out on this home.Home Values in the Area
Average Home Value in this Area
Purchase History
We collect this data history from publicly available records. To have your information removed, we recommend requesting removal directly through your county’s website.
| Date | Buyer | Sale Price | Title Company |
|---|---|---|---|
| $1,350,000 | Fidelity National Title Compan | ||
| $724,000 | Chicago Title Company |
Mortgage History
We collect this data history from publicly available records. To have your information removed, we recommend requesting removal directly through your county’s website.
| Date | Status | Borrower | Loan Amount |
|---|---|---|---|
| Previous Owner | $250,000 | ||
| Previous Owner | $620,000 |
Tax History
We collect this data history from publicly available records. To have your information removed, we recommend requesting removal directly through your county’s website.
| Year | Tax Paid | Tax Assessment Tax Assessment Total Assessment is a certain percentage of the fair market value that is determined by local assessors to be the total taxable value of land and additions on the property. | Land | Improvement |
|---|---|---|---|---|
| 2025 | $15,740 | $1,404,540 | $468,180 | $936,360 |
| 2024 | $14,886 | $1,377,000 | $459,000 | $918,000 |
| 2023 | $13,947 | $1,282,163 | $267,948 | $1,014,215 |
| 2022 | $13,761 | $1,257,024 | $262,695 | $994,329 |
| 2021 | $12,263 | $1,100,000 | $350,000 | $750,000 |
| 2020 | $12,488 | $1,100,000 | $350,000 | $750,000 |
| 2019 | $12,550 | $1,100,000 | $350,000 | $750,000 |
| 2018 | $11,423 | $1,075,000 | $350,000 | $725,000 |
| 2017 | $11,249 | $1,000,000 | $350,000 | $650,000 |
| 2016 | $9,896 | $875,000 | $350,000 | $525,000 |
| 2015 | $9,885 | $875,000 | $350,000 | $525,000 |
| 2014 | $10,141 | $900,000 | $300,000 | $600,000 |
Map
- 6 Westmont Ct
- 450 El Portal Dr
- 413 El Portal Ct
- 3216 El Capitan Ave
- 434 Occidental Ct
- 3454 G St
- 544 Seminole Dr
- 3125 El Capitan Ave
- 3519 Cordova Ave
- 3350 M St Unit 45
- 44 Silverhorn Ct
- 639 Royal Arch Ct
- 3341 Happy Isles Ct
- 3553 Beals Ave
- 3583 Vernal Ave
- 3552 Wathen Ct
- 692 Gateway Cir
- 447 Gail Ct
- 589 Leslie Ct
- 1073 El Portal Dr
- 3313 G St
- 3109 Campus Dr
- 3113 Campus Dr
- 3125 Campus Dr
- 3337 G St Unit C
- 3337 G St
- 3344 G St Unit D
- 3321 El Dorado Ct
- 3311 El Dorado Ct
- 3139 Campus Dr
- 3331 El Dorado Ct
- 3321 G St Unit C
- 3321 G St Unit B
- 3321 G St
- 3341 El Dorado Ct
- 3349 G St Unit F
- 3349 G St
- 3349 "G St
- 3349 G St Unit E
- 3349 G St Unit B
Ask me questions while you tour the home.