3305 N Carriageway Dr Arlington Heights, IL 60004
Estimated Value: $497,000 - $668,000
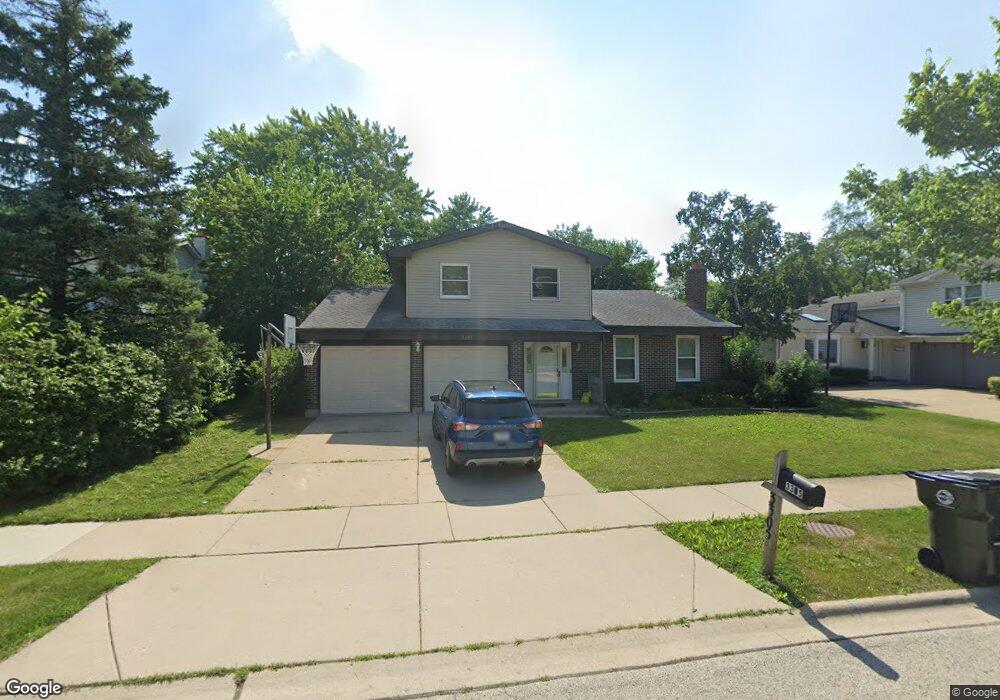
About This Home
Amazing bright and airy 4 Bedroom and 3.5 Bathrooms. Split Level. Just Minutes from Freeway access!. The home features an open updated Kitchen new refrigerator and double convection oven, corian counter tops in kitchen which opens to a great sized living room and dining room with fireplace, First floor master suite with a separate bathroom and a walk in closet. The upstairs has a second large master suite with a full bathroom and walk in closet, two additional bedrooms and adjacent full bath. Basement is also present for Storage.
Refrigerator 2023 Dishwasher 2022. Home warranty expires March 2027.
Entire house with 4 bedrooms, 4 bath and 2 parking garage with additional 2 parking on driveway is available for rent starting 1st November 2024. Credit score 650+.
Renter pays for the Utilities. Whole house is for rent with 4 Bedroom and 4 bathroom. 1 month security deposit due at signing. Lease for 1 year minimum.
Ownership History
Purchase Details
Home Financials for this Owner
Home Financials are based on the most recent Mortgage that was taken out on this home.Home Values in the Area
Average Home Value in this Area
Purchase History
| Date | Buyer | Sale Price | Title Company |
|---|---|---|---|
| Gupta Ashish | $474,000 | Citywide Title | |
| Gupta Ashish | $474,000 | Citywide Title |
Mortgage History
| Date | Status | Borrower | Loan Amount |
|---|---|---|---|
| Open | Gupta Ashish | $220,000 | |
| Closed | Gupta Ashish | $220,000 |
Property History
| Date | Event | Price | List to Sale | Price per Sq Ft |
|---|---|---|---|---|
| 11/18/2024 11/18/24 | Off Market | $3,750 | -- | -- |
| 11/01/2024 11/01/24 | For Rent | $3,750 | 0.0% | -- |
| 10/08/2024 10/08/24 | Off Market | $3,750 | -- | -- |
| 09/25/2024 09/25/24 | For Rent | $3,750 | -- | -- |
Tax History Compared to Growth
Tax History
| Year | Tax Paid | Tax Assessment Tax Assessment Total Assessment is a certain percentage of the fair market value that is determined by local assessors to be the total taxable value of land and additions on the property. | Land | Improvement |
|---|---|---|---|---|
| 2024 | $12,395 | $45,000 | $9,625 | $35,375 |
| 2023 | $3,870 | $45,000 | $9,625 | $35,375 |
| 2022 | $3,870 | $45,000 | $9,625 | $35,375 |
| 2021 | $4,359 | $38,856 | $5,468 | $33,388 |
| 2020 | $13,263 | $38,856 | $5,468 | $33,388 |
| 2019 | $3,943 | $43,318 | $5,468 | $37,850 |
| 2018 | $12,682 | $43,680 | $4,812 | $38,868 |
| 2017 | $4,256 | $43,680 | $4,812 | $38,868 |
| 2016 | $4,872 | $43,680 | $4,812 | $38,868 |
| 2015 | $5,543 | $38,609 | $4,156 | $34,453 |
| 2014 | $5,329 | $38,609 | $4,156 | $34,453 |
| 2013 | $5,066 | $38,609 | $4,156 | $34,453 |
Map
- 3300 N Carriageway Dr Unit 317
- 3451 N Carriageway Dr Unit 503
- 3157 N Daniels Ct Unit 1502
- 3023 N Windsor Dr
- 1127 Miller Ln Unit 107
- 972 Thornton Ln Unit 102
- 1225 Radcliffe Rd Unit 2
- 1115 Miller Ln Unit 104
- 820 Weidner Rd Unit 4013
- 820 Weidner Rd Unit 409
- 3401 N Ellen Dr
- 665 Thornwood Dr
- 1306 E Best Dr
- 3400 N Buffalo Grove Rd
- 3222 N Heritage Ln
- 3227 N Heritage Ln
- 18 E Heritage Ct
- 813 Stradford Cir Unit 21B2
- 720 Weidner Rd Unit 302
- 12 Oak Creek Dr Unit 2212
- 3311 N Carriageway Dr
- 3239 N Carriageway Dr
- 3304 N Page St
- 3308 N Page St
- 3235 N Carriageway Dr
- 3236 N Volz Dr W
- 3231 N Carriageway Dr
- 3232 N Volz Dr W
- 3300 N Carriageway Dr Unit 417
- 3300 N Carriageway Dr Unit 404
- 3300 N Carriageway Dr Unit 214
- 3300 N Carriageway Dr Unit 411
- 3300 N Carriageway Dr Unit 420
- 3300 N Carriageway Dr Unit 105
- 3300 N Carriageway Dr Unit 215
- 3300 N Carriageway Dr Unit 306
- 3300 N Carriageway Dr Unit 111
- 3300 N Carriageway Dr Unit 107
- 3300 N Carriageway Dr Unit 118
- 3300 N Carriageway Dr Unit 206