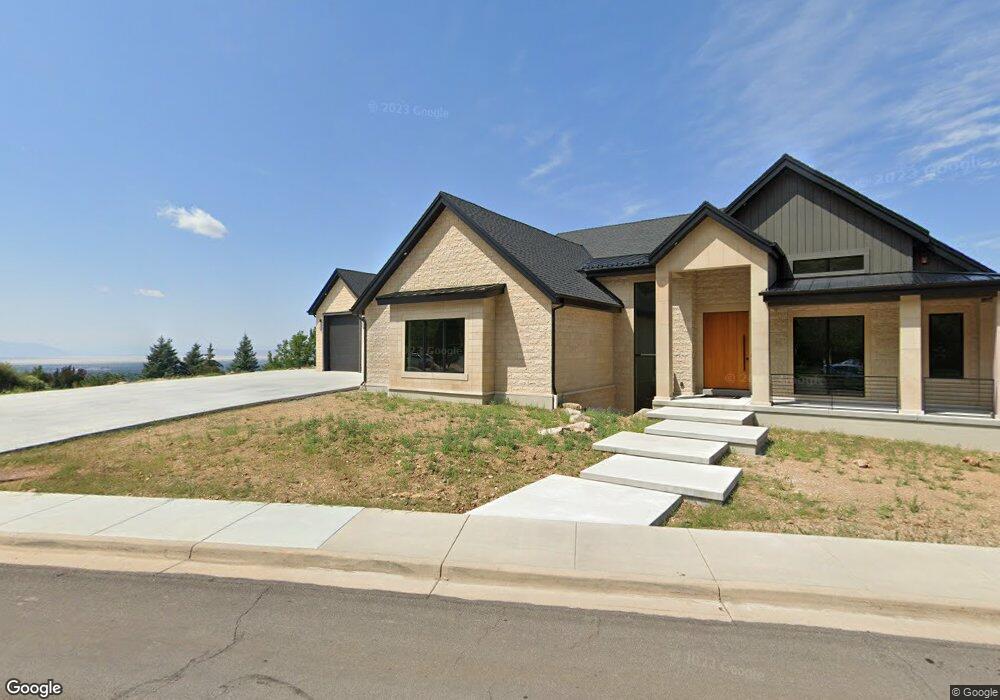
3305 N Shoreline Cir Layton, UT 84040
Estimated Value: $1,643,000 - $2,572,000
5
Beds
5
Baths
6,689
Sq Ft
$316/Sq Ft
Est. Value
About This Home
This home is located at 3305 N Shoreline Cir, Layton, UT 84040 and is currently estimated at $2,111,353, approximately $315 per square foot. 3305 N Shoreline Cir is a home located in Davis County with nearby schools including East Layton Elementary School, Central Davis Junior High School, and Northridge High School.
Ownership History
Date
Name
Owned For
Owner Type
Purchase Details
Closed on
Apr 6, 2023
Sold by
Thompson Jared
Bought by
Nelson Brian G and Rios Deborah L
Current Estimated Value
Home Financials for this Owner
Home Financials are based on the most recent Mortgage that was taken out on this home.
Original Mortgage
$1,782,435
Outstanding Balance
$1,730,099
Interest Rate
6.5%
Mortgage Type
New Conventional
Estimated Equity
$381,254
Purchase Details
Closed on
May 3, 2005
Sold by
Exchange 04-2452 Llc
Bought by
Tanner Blaine L and Tanner Rebecca
Purchase Details
Closed on
May 18, 2004
Sold by
M & Y Layton Llc
Bought by
Exchange 04-2452 Llc
Home Financials for this Owner
Home Financials are based on the most recent Mortgage that was taken out on this home.
Original Mortgage
$180,000
Interest Rate
5.77%
Mortgage Type
Purchase Money Mortgage
Create a Home Valuation Report for This Property
The Home Valuation Report is an in-depth analysis detailing your home's value as well as a comparison with similar homes in the area
Home Values in the Area
Average Home Value in this Area
Purchase History
| Date | Buyer | Sale Price | Title Company |
|---|---|---|---|
| Nelson Brian G | -- | Hickman Land Title | |
| Tanner Blaine L | -- | Western States Title Company | |
| Exchange 04-2452 Llc | -- | Western States Title Company |
Source: Public Records
Mortgage History
| Date | Status | Borrower | Loan Amount |
|---|---|---|---|
| Open | Nelson Brian G | $1,782,435 | |
| Previous Owner | Exchange 04-2452 Llc | $180,000 |
Source: Public Records
Tax History Compared to Growth
Tax History
| Year | Tax Paid | Tax Assessment Tax Assessment Total Assessment is a certain percentage of the fair market value that is determined by local assessors to be the total taxable value of land and additions on the property. | Land | Improvement |
|---|---|---|---|---|
| 2025 | $10,354 | $1,086,800 | $261,593 | $825,207 |
| 2024 | $8,853 | $936,100 | $263,301 | $672,799 |
| 2023 | $10,832 | $2,019,000 | $368,248 | $1,650,752 |
| 2022 | $6,053 | $612,700 | $197,815 | $414,885 |
| 2021 | $5,008 | $755,897 | $295,518 | $460,379 |
| 2020 | $3,672 | $531,784 | $272,821 | $258,963 |
| 2019 | $3,478 | $271,338 | $271,338 | $0 |
| 2018 | $3,265 | $255,665 | $255,665 | $0 |
| 2016 | $2,555 | $187,639 | $187,639 | $0 |
| 2015 | $2,693 | $187,765 | $187,765 | $0 |
| 2014 | $41 | $187,765 | $187,765 | $0 |
| 2013 | -- | $194,588 | $194,588 | $0 |
Source: Public Records
Map
Nearby Homes
- 3532 N Layton Ridge Dr
- 3606 N 2775 E
- 3624 N 2775 E
- 2777 E 2700 N
- 3785 N 2675 E
- 2368 E 8300 S
- 2681 E Sunshine Ct
- 8149 S 2425 E
- 2277 E 3225 N
- 3680 N 2300 E
- 2255 E 3225 N
- 2273 Snoqualmie Dr
- 2256 E 8240 S
- 3302 N 2175 E
- 2594 Joni Dr
- 2563 E 2250 N
- 2136 N 2800 E
- 2008 E Redtail Way
- 303 S 2700 E
- 305 S 2700 E Unit 305
- 3305 N Shoreline Cir Unit 11
- 3335 N Shoreline Cir
- 3306 N Shoreline Cir Unit 14
- 3306 N Shoreline Cir Unit 14
- 3273 N Shoreline Cir
- 3174 E Layton Ridge Dr
- 3174 E Layton Ridge Dr
- 3174 E Layton Ridge Dr Unit 5
- 3208 E Layton Ridge Dr
- 3268 N Shoreline Cir Unit 13
- 3367 N Shoreline Cir
- 3296 N Layton Ridge Dr Unit 4
- 3344 N Shoreline Cir Unit 15
- 3344 N Shoreline Cir Unit 15
- 3344 N Shoreline Cir
- 3228 E Layton Ridge Dr
- 3397 N Shoreline Cir
- 3185 E Layton Ridge Dr
- 3382 N Shoreline Cir
- 3213 E Layton Ridge Dr