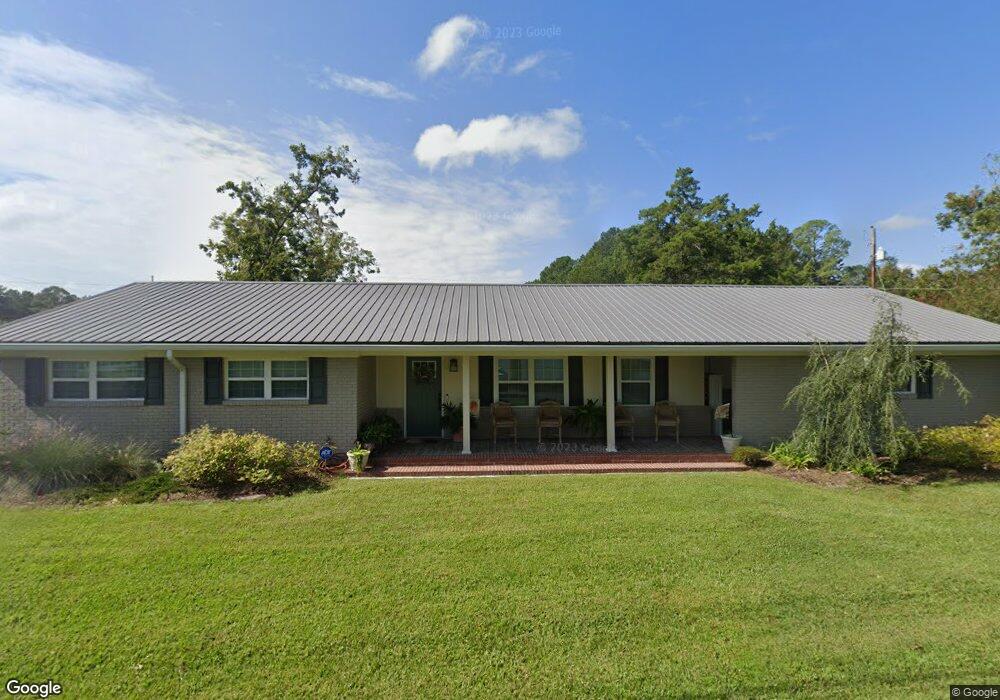
3305 Oquinn St Patterson, GA 31557
Estimated Value: $160,177 - $207,000
3
Beds
1
Bath
1,464
Sq Ft
$126/Sq Ft
Est. Value
About This Home
This home is located at 3305 Oquinn St, Patterson, GA 31557 and is currently estimated at $184,044, approximately $125 per square foot. 3305 Oquinn St is a home located in Pierce County with nearby schools including Pierce County High School and Southeast Christian Academy.
Ownership History
Date
Name
Owned For
Owner Type
Purchase Details
Closed on
Dec 31, 2018
Sold by
Kicklighter Donald Hugh
Bought by
Kicklighter Lisa Sapp
Current Estimated Value
Purchase Details
Closed on
Nov 14, 2017
Sold by
Kicklighter Lisa Sapp
Bought by
Kicklighter Lisa Sapp and Kicklighter Donald Hugh
Purchase Details
Closed on
Jul 5, 2016
Bought by
Denison Joseph Armond
Purchase Details
Closed on
Jul 30, 1968
Sold by
Echols J O
Bought by
Thornton Felton
Purchase Details
Closed on
Dec 16, 1961
Sold by
Griner Leola
Bought by
Thornton Felton and Annie Belle
Create a Home Valuation Report for This Property
The Home Valuation Report is an in-depth analysis detailing your home's value as well as a comparison with similar homes in the area
Home Values in the Area
Average Home Value in this Area
Purchase History
| Date | Buyer | Sale Price | Title Company |
|---|---|---|---|
| Kicklighter Lisa Sapp | -- | -- | |
| Kicklighter Lisa Sapp | -- | -- | |
| Denison Joseph Armond | -- | -- | |
| Thornton Felton | -- | -- | |
| Thornton Felton | -- | -- |
Source: Public Records
Tax History Compared to Growth
Tax History
| Year | Tax Paid | Tax Assessment Tax Assessment Total Assessment is a certain percentage of the fair market value that is determined by local assessors to be the total taxable value of land and additions on the property. | Land | Improvement |
|---|---|---|---|---|
| 2025 | $1,894 | $62,901 | $2,304 | $60,597 |
| 2024 | $1,894 | $60,263 | $2,304 | $57,959 |
| 2023 | $1,859 | $59,167 | $2,304 | $56,863 |
| 2022 | $1,227 | $34,586 | $3,132 | $31,454 |
| 2021 | $1,260 | $33,268 | $3,132 | $30,136 |
| 2020 | $1,225 | $31,949 | $3,132 | $28,817 |
| 2019 | $1,225 | $31,949 | $3,132 | $28,817 |
| 2018 | $1,177 | $30,630 | $3,132 | $27,498 |
| 2017 | $1,150 | $29,839 | $3,132 | $26,707 |
| 2016 | $1,147 | $29,839 | $3,132 | $26,707 |
| 2015 | $401 | $29,839 | $3,132 | $26,707 |
| 2014 | $401 | $29,839 | $3,132 | $26,707 |
| 2013 | $401 | $29,839 | $3,132 | $26,706 |
Source: Public Records
Map
Nearby Homes
- 5525 E Railroad Ave
- 5518 W Railroad Ave
- 3532 Dallas St
- 5612 Hickory Dr
- 3548 Williams St
- 6034 E Main St
- 5947 Reese St
- 3881 Cut Path Rd
- 6162 Griner Rd
- 2460 Thornton Rd
- 5466 Robin Rd
- 6204 Cross Swamp Rd
- 5466 Robbin Rd
- 2114 Mill Creek Rd
- 4725 Otter Creek Cir
- 0 Otter Creek Rd Unit 23325273
- 0 Ga Hwy 32
- 4720 Otter Creek Cir
- 4750 Otter Creek Cir
- 5907 Owens Rd
- 5515 Lewis St
- 5514 Lewis St
- 5504 Lewis St
- 3316 Thomas St
- 5520 Lewis St
- 6450 U S 84
- 6470 Us Highway 84
- 5518 Gardner St
- 5512 Gardner St
- 00 Thomas St
- 5725 W Main St
- 0 Thomas St Unit 7018199
- 3340 Thomas St
- 3331 Thomas St
- 5506 Gardner St
- 5511 Gardner St
- 6149 W Main St
- 6149 W Main St Unit PATTERSON, GA 31557
- 6445 Us Highway 84
- 5701 W Main St