3305 Probasco Way Sparks, NV 89431
McCarran Boulevard-Probasco NeighborhoodEstimated Value: $395,083 - $435,000
3
Beds
2
Baths
1,344
Sq Ft
$315/Sq Ft
Est. Value
About This Home
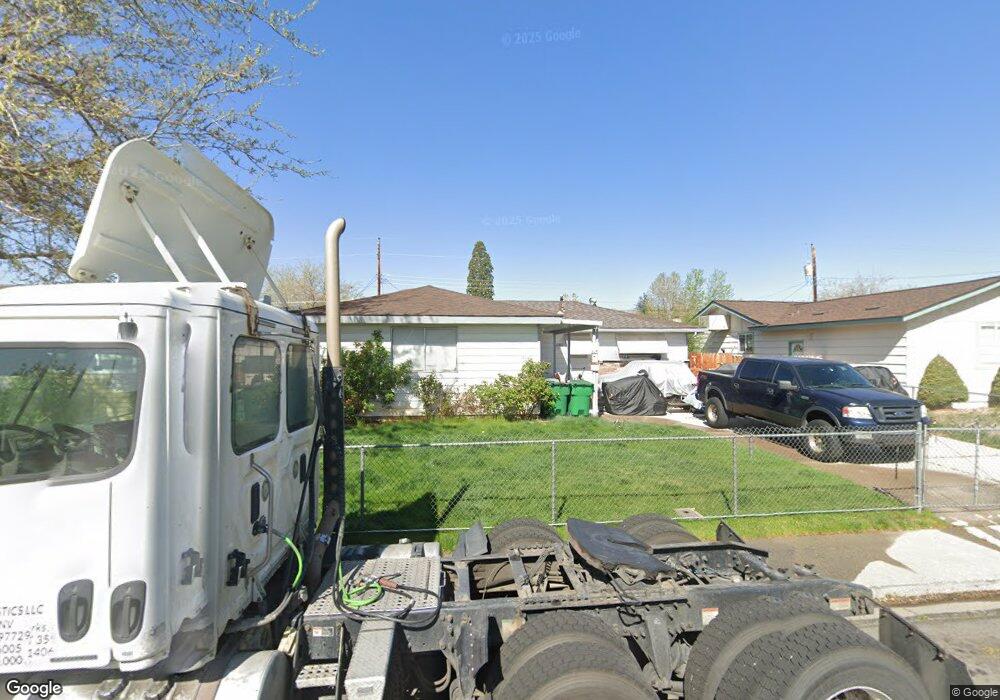
This home is located at 3305 Probasco Way, Sparks, NV 89431 and is currently estimated at $424,021, approximately $315 per square foot. 3305 Probasco Way is a home located in Washoe County with nearby schools including Lena Juniper Elementary School, Lou Mendive Middle School, and Edward C Reed High School.
Ownership History
Date
Name
Owned For
Owner Type
Purchase Details
Closed on
Feb 12, 2013
Sold by
Sanderson Kimarie
Bought by
The Kimarie L Sanderson Living Trust
Current Estimated Value
Purchase Details
Closed on
May 5, 2010
Sold by
Cole Gale Dean
Bought by
The Gale D Cole Living Trust
Purchase Details
Closed on
Dec 29, 2006
Sold by
Cole Gale D and Cole Irene L
Bought by
Cole Gale Dean and Cole Irene Lina
Purchase Details
Closed on
Oct 23, 1996
Sold by
Cole Gregory D and Cole Gale D
Bought by
Cole Gale D and Cole Irene L
Home Financials for this Owner
Home Financials are based on the most recent Mortgage that was taken out on this home.
Original Mortgage
$43,500
Interest Rate
8.3%
Create a Home Valuation Report for This Property
The Home Valuation Report is an in-depth analysis detailing your home's value as well as a comparison with similar homes in the area
Home Values in the Area
Average Home Value in this Area
Purchase History
| Date | Buyer | Sale Price | Title Company |
|---|---|---|---|
| The Kimarie L Sanderson Living Trust | -- | None Available | |
| Sanderson Kimarie | -- | None Available | |
| The Gale D Cole Living Trust | -- | None Available | |
| Cole Gale Dean | -- | None Available | |
| Cole Gale D | -- | Founders Title Co |
Source: Public Records
Mortgage History
| Date | Status | Borrower | Loan Amount |
|---|---|---|---|
| Previous Owner | Cole Gale D | $43,500 |
Source: Public Records
Tax History
| Year | Tax Paid | Tax Assessment Tax Assessment Total Assessment is a certain percentage of the fair market value that is determined by local assessors to be the total taxable value of land and additions on the property. | Land | Improvement |
|---|---|---|---|---|
| 2026 | -- | $53,686 | $34,090 | $19,596 |
| 2025 | $894 | $52,594 | $33,565 | $19,029 |
| 2024 | $894 | $48,789 | $30,065 | $18,724 |
| 2023 | $828 | $48,639 | $31,325 | $17,314 |
| 2022 | $767 | $40,314 | $26,180 | $14,134 |
| 2021 | $711 | $31,721 | $17,955 | $13,766 |
| 2020 | $703 | $30,451 | $16,940 | $13,511 |
| 2019 | $670 | $28,667 | $15,890 | $12,777 |
| 2018 | $652 | $23,978 | $11,725 | $12,253 |
| 2017 | $633 | $22,428 | $10,395 | $12,033 |
| 2016 | $617 | $21,378 | $9,345 | $12,033 |
| 2015 | $616 | $19,639 | $7,700 | $11,939 |
| 2014 | $598 | $17,694 | $6,440 | $11,254 |
| 2013 | -- | $15,880 | $4,270 | $11,610 |
Source: Public Records
Map
Nearby Homes
- 240 E Gault Way
- 3104 Sandy St
- 491 E Emerson Way
- 3273 N Truckee Ln
- 3122 Shari Way
- 2557 Janelle Dr
- 3126 N Truckee Ln
- 867 Spanish Springs Rd
- 930 Spanish Springs Rd
- 28 Arndell Way
- 2475 Stine Way
- 2520 Nelson Way
- 3222 Bunker Hill Ln
- 343 Richards Way
- 705 York Way
- 1069 Palmwood Dr
- 181 Quail St
- 1940 4th St Unit 20
- 1940 4th St Unit 51
- 1940 4th St Unit 46
- 3285 Probasco Way
- 3315 Probasco Way
- 3280 Vickie Ln
- 3310 Vickie Ln
- 3270 Vickie Ln
- 3275 Probasco Way
- 3260 Vickie Ln
- 3330 Vickie Ln
- 3280 Probasco Way
- 3310 Probasco Way
- 3320 Probasco Way
- 3335 Probasco Way
- 3265 Probasco Way
- 3270 Probasco Way
- 3250 Vickie Ln
- 3340 Vickie Ln
- 3330 Probasco Way
- 3260 Probasco Way
- 3255 Probasco Way
Your Personal Tour Guide
Ask me questions while you tour the home.