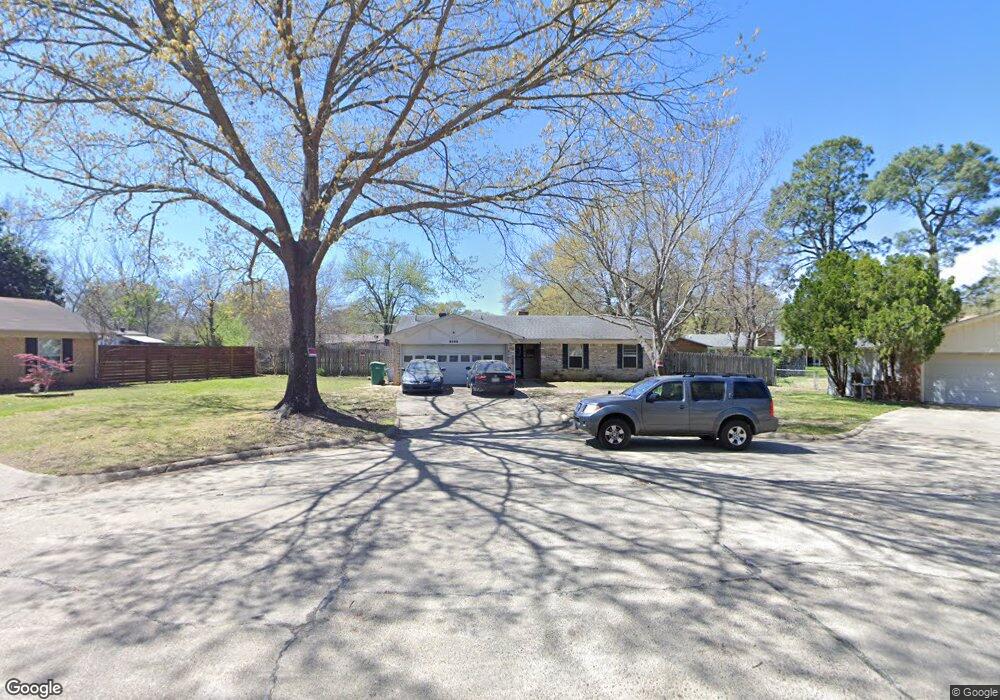
3305 Robin Cir Texarkana, TX 75503
Estimated Value: $155,000 - $206,000
3
Beds
2
Baths
1,415
Sq Ft
$127/Sq Ft
Est. Value
About This Home
This home is located at 3305 Robin Cir, Texarkana, TX 75503 and is currently estimated at $179,862, approximately $127 per square foot. 3305 Robin Cir is a home located in Bowie County with nearby schools including Margaret Fischer Davis Elementary School, Pleasant Grove Intermediate School, and Pleasant Grove Middle School.
Ownership History
Date
Name
Owned For
Owner Type
Purchase Details
Closed on
Nov 23, 2016
Sold by
Hardy Russell Ervin and Wing Angela Gail
Bought by
Massey Tammie and Hardy Russell Ervin
Current Estimated Value
Home Financials for this Owner
Home Financials are based on the most recent Mortgage that was taken out on this home.
Original Mortgage
$118,219
Outstanding Balance
$97,311
Interest Rate
4.25%
Mortgage Type
FHA
Estimated Equity
$82,551
Purchase Details
Closed on
Mar 10, 2015
Sold by
Wing Angela Gail
Bought by
Hardt Russell Ervin
Purchase Details
Closed on
Apr 13, 2006
Sold by
Endsley Karen S and Endsley Karen C
Bought by
Wing Angela Gail
Home Financials for this Owner
Home Financials are based on the most recent Mortgage that was taken out on this home.
Original Mortgage
$90,081
Interest Rate
6.22%
Mortgage Type
FHA
Create a Home Valuation Report for This Property
The Home Valuation Report is an in-depth analysis detailing your home's value as well as a comparison with similar homes in the area
Home Values in the Area
Average Home Value in this Area
Purchase History
| Date | Buyer | Sale Price | Title Company |
|---|---|---|---|
| Massey Tammie | -- | Stewart Title | |
| Hardt Russell Ervin | -- | None Available | |
| Wing Angela Gail | -- | None Available |
Source: Public Records
Mortgage History
| Date | Status | Borrower | Loan Amount |
|---|---|---|---|
| Open | Massey Tammie | $118,219 | |
| Previous Owner | Wing Angela Gail | $90,081 |
Source: Public Records
Tax History Compared to Growth
Tax History
| Year | Tax Paid | Tax Assessment Tax Assessment Total Assessment is a certain percentage of the fair market value that is determined by local assessors to be the total taxable value of land and additions on the property. | Land | Improvement |
|---|---|---|---|---|
| 2025 | $1,963 | $151,806 | $25,000 | $126,806 |
| 2024 | $1,963 | $141,227 | $25,000 | $125,090 |
| 2023 | $2,890 | $128,388 | $0 | $0 |
| 2022 | $2,866 | $126,613 | $22,000 | $104,613 |
| 2021 | $2,775 | $106,105 | $20,000 | $86,105 |
| 2020 | $2,687 | $102,201 | $20,000 | $82,201 |
| 2019 | $2,657 | $98,485 | $20,000 | $78,485 |
| 2018 | $2,594 | $96,715 | $20,000 | $76,715 |
| 2017 | $2,496 | $93,294 | $18,000 | $75,294 |
| 2016 | $2,496 | $93,294 | $18,000 | $75,294 |
| 2015 | $1,704 | $94,698 | $18,000 | $76,698 |
| 2014 | $1,704 | $91,926 | $18,000 | $73,926 |
Source: Public Records
Map
Nearby Homes
- 4011 Columbine Ln
- TBD Hidden Ac Dr Lot 17
- 0 Greenbriar Lot 14
- hwy 71 N 71 N
- N/A Richmond Meadows
- 101 Sierra Madre Ln
- 3620 Moores Ln
- 1519 Moores Ln
- 3506 Moores Ln
- 5917 Sidney Dr
- 204 Arroyo Dr
- 3 Spring Cove
- 6005 Stoneridge Dr
- hawkins Hawkins
- 0 Cowhorn Creek Loop
- 2 Windmere Dr
- 6010 Shadyside Ln
- TBD U S 59
- 3108 Crestridge Dr