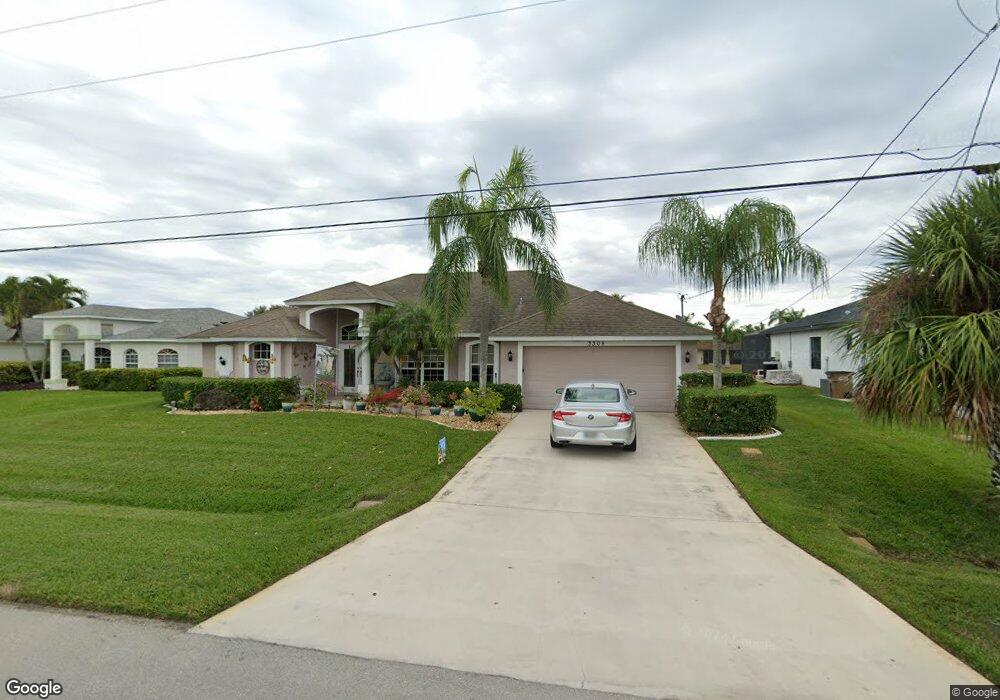
3305 SW 5th Place Unit 45 Cape Coral, FL 33914
Pelican NeighborhoodEstimated Value: $422,000 - $615,000
4
Beds
2
Baths
3,109
Sq Ft
$174/Sq Ft
Est. Value
About This Home
This home is located at 3305 SW 5th Place Unit 45, Cape Coral, FL 33914 and is currently estimated at $539,867, approximately $173 per square foot. 3305 SW 5th Place Unit 45 is a home located in Lee County with nearby schools including Cape Elementary School, Caloosa Elementary School, and Tropic Isles Elementary School.
Ownership History
Date
Name
Owned For
Owner Type
Purchase Details
Closed on
Jul 1, 2014
Sold by
Boschmans Elvire
Bought by
Owens Jerrold K and Owens Kay L
Current Estimated Value
Home Financials for this Owner
Home Financials are based on the most recent Mortgage that was taken out on this home.
Original Mortgage
$212,000
Outstanding Balance
$161,903
Interest Rate
4.23%
Mortgage Type
New Conventional
Estimated Equity
$377,964
Purchase Details
Closed on
Apr 19, 2011
Sold by
Boschmans Elvire
Bought by
Boschmans Elvire and Rasmussen Ingeborg M R
Purchase Details
Closed on
Mar 12, 2008
Sold by
Burdulis Robin C
Bought by
Boschmans Elvire
Purchase Details
Closed on
Feb 24, 2003
Sold by
Spring Russell and Spring Elizabeth
Bought by
Burdullis Robin C
Purchase Details
Closed on
Jun 1, 2001
Sold by
Zerbini Marcella
Bought by
Spring Russell and Spring Elizabeth
Create a Home Valuation Report for This Property
The Home Valuation Report is an in-depth analysis detailing your home's value as well as a comparison with similar homes in the area
Home Values in the Area
Average Home Value in this Area
Purchase History
| Date | Buyer | Sale Price | Title Company |
|---|---|---|---|
| Owens Jerrold K | $265,000 | Cape Coral Title Insurance A | |
| Boschmans Elvire | $1,000 | None Available | |
| Boschmans Elvire | $290,000 | Jm Title Corp | |
| Burdullis Robin C | $24,000 | -- | |
| Spring Russell | $12,000 | -- |
Source: Public Records
Mortgage History
| Date | Status | Borrower | Loan Amount |
|---|---|---|---|
| Open | Owens Jerrold K | $212,000 |
Source: Public Records
Tax History Compared to Growth
Tax History
| Year | Tax Paid | Tax Assessment Tax Assessment Total Assessment is a certain percentage of the fair market value that is determined by local assessors to be the total taxable value of land and additions on the property. | Land | Improvement |
|---|---|---|---|---|
| 2025 | $4,570 | $281,530 | -- | -- |
| 2024 | $4,418 | $273,596 | -- | -- |
| 2023 | $4,418 | $265,627 | $0 | $0 |
| 2022 | $4,144 | $257,890 | $0 | $0 |
| 2021 | $4,256 | $293,448 | $31,000 | $262,448 |
| 2020 | $4,324 | $246,922 | $0 | $0 |
| 2019 | $4,200 | $241,370 | $0 | $0 |
| 2018 | $4,195 | $236,869 | $0 | $0 |
| 2017 | $4,179 | $231,997 | $0 | $0 |
| 2016 | $4,101 | $227,225 | $22,000 | $205,225 |
| 2015 | $4,154 | $226,112 | $18,500 | $207,612 |
| 2014 | -- | $208,193 | $20,000 | $188,193 |
| 2013 | -- | $205,086 | $13,900 | $191,186 |
Source: Public Records
Map
Nearby Homes
- 3207 SW 5th Place
- 3404 SW 5th Ave
- 3206 SW 5th Ave
- 419 SW 34th St
- 3416 SW 5th Ave
- 404 SW 33rd Terrace
- 621 Gleason Pkwy
- 625 Gleason Pkwy
- 618 SW 31st Terrace
- 2932 SW 7th Place
- 301 SW 32nd Terrace
- 3033 SW 5th Ave
- 624 SW 35th St
- 314 SW 31st Terrace
- 3021 SW 5th Ave
- 310 SW 31st Terrace
- 707 SW 35th Terrace
- 302 SW 31st Terrace
- 231 Gleason Pkwy
- 802 SW 31st Terrace
- 3309 SW 5th Place
- 3313 SW 5th Place
- 3227 SW 5th Place
- 3306 SW 5th Place
- 3302 SW 5th Place
- 3310 SW 5th Place
- 3306 SW 5th Ave
- 3310 SW 5th Ave
- 3223 SW 5th Place
- 3226 SW 5th Place
- 3314 SW 5th Place
- 3314 SW 5th Ave
- 3226 SW 5th Ave
- 3305 SW 6th Ave
- 3309 SW 6th Ave
- 3222 SW 5th Place
- 3321 SW 5th Place
- 3219 SW 5th Place Unit 45
- 3629 SW 5th Place
- 3415 SW 5th Place