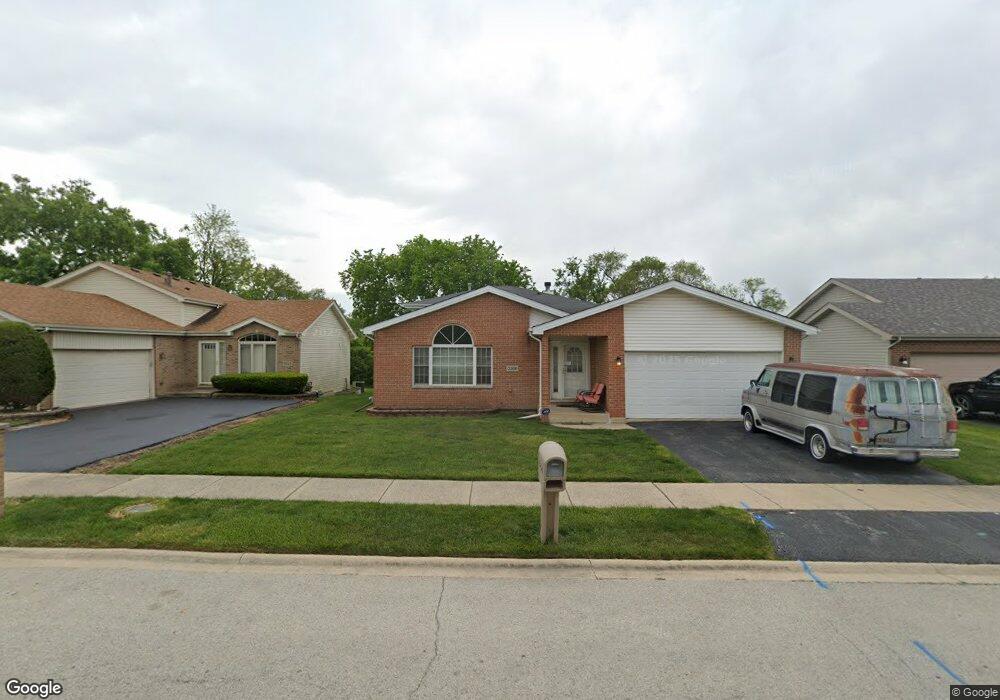
3306 Bramanti Trail Steger, IL 60475
Estimated Value: $243,229 - $306,000
3
Beds
3
Baths
1,368
Sq Ft
$201/Sq Ft
Est. Value
About This Home
This home is located at 3306 Bramanti Trail, Steger, IL 60475 and is currently estimated at $275,557, approximately $201 per square foot. 3306 Bramanti Trail is a home located in Cook County with nearby schools including Steger Primary Center, Steger Intermediate Center, and Columbia Central School.
Ownership History
Date
Name
Owned For
Owner Type
Purchase Details
Closed on
Apr 12, 2019
Sold by
Gardner Hudson Beverly and Hudson William P
Bought by
Gardner Hudson Beverly and Hudson William P
Current Estimated Value
Purchase Details
Closed on
Nov 30, 2001
Sold by
Greene Alfonzo
Bought by
Gardner Hudson Beverly
Home Financials for this Owner
Home Financials are based on the most recent Mortgage that was taken out on this home.
Original Mortgage
$132,000
Outstanding Balance
$62,594
Interest Rate
9.5%
Estimated Equity
$212,963
Purchase Details
Closed on
May 5, 2000
Sold by
Phillippe Construction Inc
Bought by
Greene Alfonzo and Greene Alfonso
Home Financials for this Owner
Home Financials are based on the most recent Mortgage that was taken out on this home.
Original Mortgage
$146,470
Interest Rate
7.83%
Purchase Details
Closed on
Jan 19, 2000
Sold by
B & L Development Corp
Bought by
Phillippe Construction Inc
Create a Home Valuation Report for This Property
The Home Valuation Report is an in-depth analysis detailing your home's value as well as a comparison with similar homes in the area
Home Values in the Area
Average Home Value in this Area
Purchase History
| Date | Buyer | Sale Price | Title Company |
|---|---|---|---|
| Gardner Hudson Beverly | -- | None Available | |
| Gardner Hudson Beverly | -- | -- | |
| Greene Alfonzo | $154,500 | -- | |
| Phillippe Construction Inc | $22,500 | -- |
Source: Public Records
Mortgage History
| Date | Status | Borrower | Loan Amount |
|---|---|---|---|
| Open | Gardner Hudson Beverly | $132,000 | |
| Previous Owner | Greene Alfonzo | $146,470 | |
| Closed | Gardner Hudson Beverly | $33,000 |
Source: Public Records
Tax History Compared to Growth
Tax History
| Year | Tax Paid | Tax Assessment Tax Assessment Total Assessment is a certain percentage of the fair market value that is determined by local assessors to be the total taxable value of land and additions on the property. | Land | Improvement |
|---|---|---|---|---|
| 2024 | $4,540 | $19,013 | $1,125 | $17,888 |
| 2023 | $2,052 | $19,013 | $1,125 | $17,888 |
| 2022 | $2,052 | $10,958 | $1,688 | $9,270 |
| 2021 | $1,993 | $10,956 | $1,687 | $9,269 |
| 2020 | $2,095 | $10,956 | $1,687 | $9,269 |
| 2019 | $3,039 | $14,097 | $1,500 | $12,597 |
| 2018 | $3,921 | $14,097 | $1,500 | $12,597 |
| 2017 | $4,252 | $14,097 | $1,500 | $12,597 |
| 2016 | $4,275 | $13,250 | $1,312 | $11,938 |
| 2015 | $4,192 | $13,250 | $1,312 | $11,938 |
| 2014 | $4,192 | $13,250 | $1,312 | $11,938 |
| 2013 | $4,044 | $13,933 | $1,312 | $12,621 |
Source: Public Records
Map
Nearby Homes
- 3032 Sandy Ridge Dr
- 189 E 34th St
- 22807 Wentworth Ave
- 3129 Butler Ave
- 3028 Florence Ave
- 3216 Butler Ave
- 3236 Hopkins St
- 22550 Miller Rd
- 3144 Phillips Ave
- 89 227th St
- 274 E 34th St
- 3216 Wallace Ave
- 205 Hereford Ave
- 3201 Union Ave
- 129 Dorsetshire Dr
- 200 Durham Dr
- 3117 Chicago Rd
- 3121 Chicago Rd
- 17 W 30th Place
- 3449 Somerset St
- 3306 Bramanti Trail
- 3300 Bramanti Trail
- 3312 Bramanti Trail
- 3318 Bramanti Trail
- 3318 Bramanti Trail
- 3260 Bramanti Trail
- 3307 Bramanti Trail
- 3324 Bramanti Trail
- 3301 Bramanti Trail
- 3311 Bramanti Trail
- 3261 Bramanti Trail
- 3261 Bramanti Trail
- 3317 Bramanti Trail
- 3252 Bramanti Trail
- 3330 Bramanti Trail
- 3255 Bramanti Trail
- 3255 Bramanti Trail
- 3323 Bramanti Trail
- 149 E 34th St
- 3249 Bramanti Trail