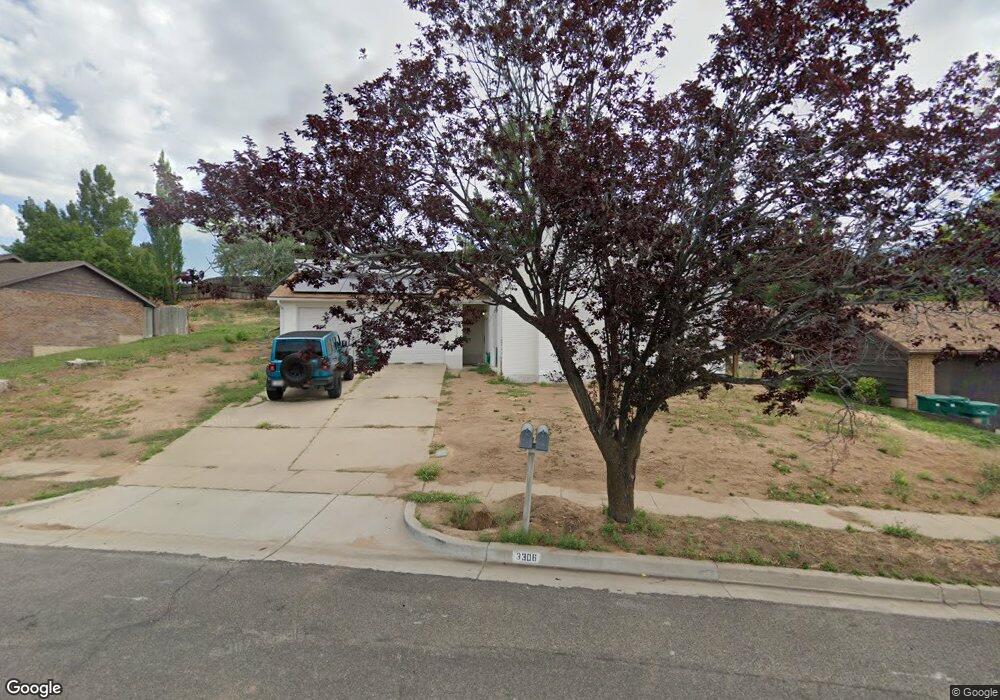
3306 N Fairfield Rd Layton, UT 84041
Estimated Value: $582,000 - $621,000
4
Beds
4
Baths
2,044
Sq Ft
$294/Sq Ft
Est. Value
About This Home
This home is located at 3306 N Fairfield Rd, Layton, UT 84041 and is currently estimated at $601,302, approximately $294 per square foot. 3306 N Fairfield Rd is a home located in Davis County with nearby schools including Mountain View Elementary School, North Layton Junior High School, and Northridge High School.
Ownership History
Date
Name
Owned For
Owner Type
Purchase Details
Closed on
Sep 28, 2023
Sold by
Jcor Properties Llc
Bought by
Clark Shaun C
Current Estimated Value
Home Financials for this Owner
Home Financials are based on the most recent Mortgage that was taken out on this home.
Original Mortgage
$485,000
Outstanding Balance
$472,153
Interest Rate
5.75%
Mortgage Type
Seller Take Back
Estimated Equity
$129,149
Purchase Details
Closed on
Jul 15, 2021
Sold by
Dyreng Laura J
Bought by
Jcor Properties Llc
Home Financials for this Owner
Home Financials are based on the most recent Mortgage that was taken out on this home.
Original Mortgage
$385,000
Interest Rate
2.9%
Mortgage Type
Commercial
Purchase Details
Closed on
Nov 27, 2018
Sold by
Dyreng Russell I
Bought by
Dyreng Laura J
Create a Home Valuation Report for This Property
The Home Valuation Report is an in-depth analysis detailing your home's value as well as a comparison with similar homes in the area
Home Values in the Area
Average Home Value in this Area
Purchase History
| Date | Buyer | Sale Price | Title Company |
|---|---|---|---|
| Clark Shaun C | -- | Cottonwood Title | |
| Jcor Properties Llc | -- | Stewart Title Ins Age | |
| Dyreng Laura J | -- | None Available |
Source: Public Records
Mortgage History
| Date | Status | Borrower | Loan Amount |
|---|---|---|---|
| Open | Clark Shaun C | $485,000 | |
| Previous Owner | Jcor Properties Llc | $385,000 |
Source: Public Records
Tax History
| Year | Tax Paid | Tax Assessment Tax Assessment Total Assessment is a certain percentage of the fair market value that is determined by local assessors to be the total taxable value of land and additions on the property. | Land | Improvement |
|---|---|---|---|---|
| 2025 | $2,845 | $298,650 | $112,520 | $186,130 |
| 2024 | $2,705 | $285,999 | $83,668 | $202,331 |
| 2023 | $1,969 | $201,850 | $80,030 | $121,819 |
| 2022 | $2,049 | $377,000 | $140,266 | $236,734 |
| 2021 | $2,266 | $342,000 | $124,978 | $217,022 |
| 2020 | $2,003 | $290,000 | $95,125 | $194,875 |
| 2019 | $1,946 | $276,000 | $78,726 | $197,274 |
| 2018 | $1,742 | $248,000 | $74,270 | $173,730 |
| 2016 | $1,656 | $121,660 | $35,048 | $86,612 |
| 2015 | $1,570 | $109,450 | $35,048 | $74,402 |
| 2014 | $1,497 | $106,765 | $35,048 | $71,717 |
| 2013 | -- | $97,254 | $28,952 | $68,302 |
Source: Public Records
Map
Nearby Homes
- 3306 N Fairfield Rd
- 3240 N Fairfield Rd Unit 6
- 935 E 3000 N Unit 183
- 935 E 3000 N Unit 175
- 935 E 3000 N Unit 165
- 935 E 3000 N Unit 26
- 935 E 3000 N Unit 90
- 935 E 3000 N Unit 27
- 935 E Highway 193 Unit 102
- 935 E 3000 N Unit 56
- 1266 E 3125 N
- 1241 E 3075 N
- 1321 E 3125 N
- 948 E Hercules Ct Unit 179
- 3176 N 1450 E
- 414 E 2625 N
- 1447 E 2700 N
- 332 Hillgate Way
- 311 Harriger Way
- 2826 N 1600 E
Your Personal Tour Guide
Ask me questions while you tour the home.