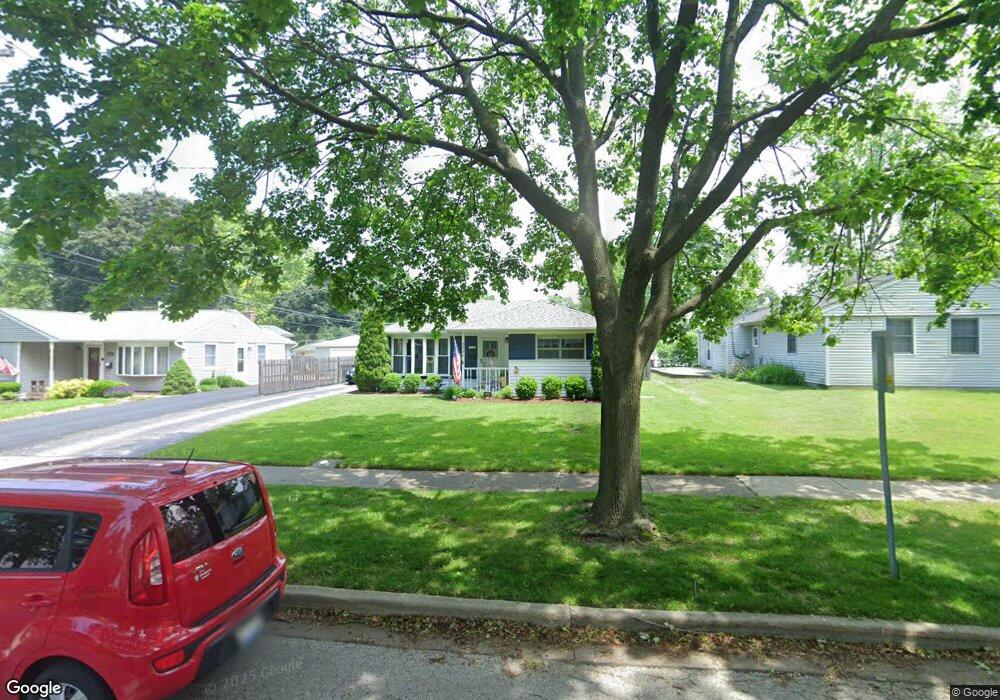
3306 Pheasant Dr Rolling Meadows, IL 60008
Estimated Value: $265,000 - $336,000
3
Beds
1
Bath
1,003
Sq Ft
$310/Sq Ft
Est. Value
About This Home
This home is located at 3306 Pheasant Dr, Rolling Meadows, IL 60008 and is currently estimated at $310,736, approximately $309 per square foot. 3306 Pheasant Dr is a home located in Cook County with nearby schools including Kimball Hill Elementary School, Carl Sandburg Junior High School, and Rolling Meadows High School.
Ownership History
Date
Name
Owned For
Owner Type
Purchase Details
Closed on
Aug 28, 2001
Sold by
Ebert John P
Bought by
Brege Thomas C and Brege Lisa B
Current Estimated Value
Home Financials for this Owner
Home Financials are based on the most recent Mortgage that was taken out on this home.
Original Mortgage
$152,400
Interest Rate
6.92%
Mortgage Type
FHA
Purchase Details
Closed on
Mar 3, 2000
Sold by
Kramer Norma Joan
Bought by
Ebert John P
Home Financials for this Owner
Home Financials are based on the most recent Mortgage that was taken out on this home.
Original Mortgage
$132,900
Interest Rate
8.31%
Create a Home Valuation Report for This Property
The Home Valuation Report is an in-depth analysis detailing your home's value as well as a comparison with similar homes in the area
Home Values in the Area
Average Home Value in this Area
Purchase History
| Date | Buyer | Sale Price | Title Company |
|---|---|---|---|
| Brege Thomas C | $165,000 | -- | |
| Ebert John P | $140,000 | -- |
Source: Public Records
Mortgage History
| Date | Status | Borrower | Loan Amount |
|---|---|---|---|
| Previous Owner | Brege Thomas C | $152,400 | |
| Previous Owner | Ebert John P | $132,900 |
Source: Public Records
Tax History
| Year | Tax Paid | Tax Assessment Tax Assessment Total Assessment is a certain percentage of the fair market value that is determined by local assessors to be the total taxable value of land and additions on the property. | Land | Improvement |
|---|---|---|---|---|
| 2025 | $6,033 | $26,000 | $5,248 | $20,752 |
| 2024 | $6,033 | $23,000 | $4,441 | $18,559 |
| 2023 | $5,747 | $23,000 | $4,441 | $18,559 |
| 2022 | $5,747 | $23,000 | $4,441 | $18,559 |
| 2021 | $5,174 | $18,954 | $2,624 | $16,330 |
| 2020 | $5,126 | $18,954 | $2,624 | $16,330 |
| 2019 | $5,164 | $21,178 | $2,624 | $18,554 |
| 2018 | $4,655 | $17,806 | $2,422 | $15,384 |
| 2017 | $4,579 | $17,806 | $2,422 | $15,384 |
| 2016 | $4,525 | $17,806 | $2,422 | $15,384 |
| 2015 | $3,995 | $15,310 | $2,220 | $13,090 |
| 2014 | $3,916 | $15,310 | $2,220 | $13,090 |
| 2013 | $3,804 | $15,310 | $2,220 | $13,090 |
Source: Public Records
Map
Nearby Homes
- 3200 Thrush Ln
- 3135 Town Square Dr Unit 401
- 3135 Town Square Dr Unit 104
- 3100 Town Square Dr Unit 308
- 3100 Town Square Dr Unit 204
- 3265 Kirchoff Rd Unit 116
- 3345 Kirchoff Rd Unit 5C
- 3306 Trillium Cir Unit 3001
- 3209 Trillium Cir
- 2709 Lily Ln
- 2705 Park St
- 3710 Meadow Dr
- 3712 Jay Ln
- 399 Knollwood Ct
- 3605 Oriole Ln
- 2201 Kingfisher Ln
- 3 Holyoke on Auburn
- 2302 Fulle St
- 2401 Rohlwing Rd
- 2600 Brookwood Way Dr Unit 316
- 3304 Pheasant Dr
- 3204 Swallow Ln
- 3202 Swallow Ln
- 3203 Hawk Ln
- 3205 Hawk Ln
- 3201 Hawk Ln
- 3200 Swallow Ln
- 3109 Hawk Ln
- 3309 Pheasant Dr
- 3307 Pheasant Dr
- 3311 Pheasant Dr
- 3205 Swallow Ln
- 3305 Pheasant Dr
- 3107 Hawk Ln
- 3108 Swallow Ln
- 3401 Pheasant Dr
- 3203 Swallow Ln
- 3303 Pheasant Dr
- 3403 Pheasant Dr
- 3105 Hawk Ln
Your Personal Tour Guide
Ask me questions while you tour the home.