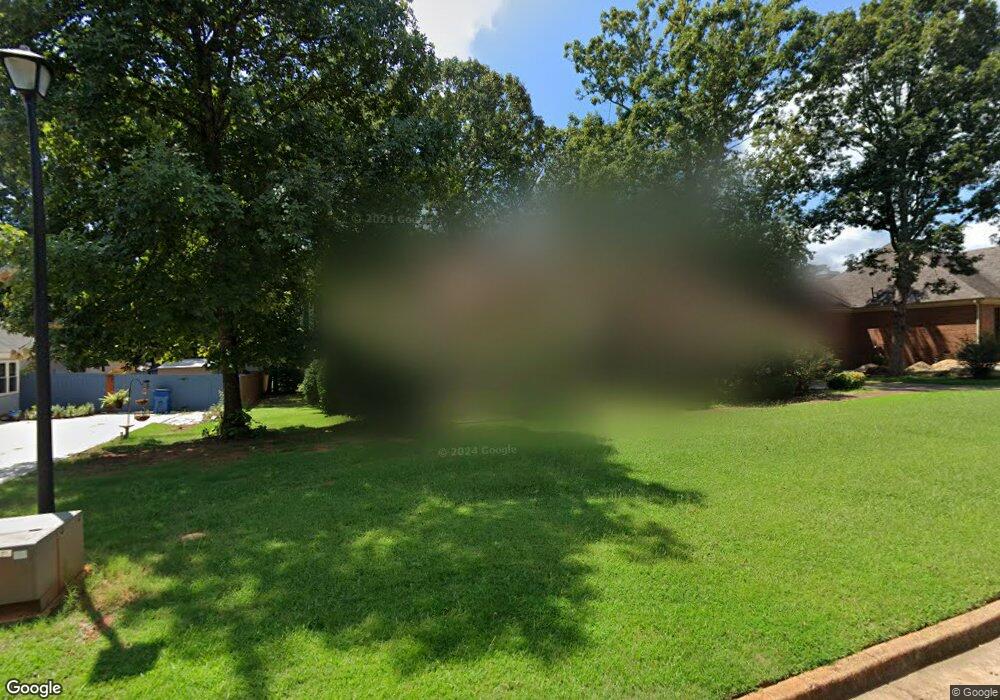
3306 Sams Way SE Conyers, GA 30013
Estimated Value: $301,713 - $374,000
3
Beds
3
Baths
2,564
Sq Ft
$136/Sq Ft
Est. Value
About This Home
This home is located at 3306 Sams Way SE, Conyers, GA 30013 and is currently estimated at $348,178, approximately $135 per square foot. 3306 Sams Way SE is a home located in Rockdale County with nearby schools including Peek's Chapel Elementary School, Memorial Middle School, and Salem High School.
Ownership History
Date
Name
Owned For
Owner Type
Purchase Details
Closed on
Feb 21, 2020
Sold by
Jones Melvin
Bought by
Cory Lakita
Current Estimated Value
Home Financials for this Owner
Home Financials are based on the most recent Mortgage that was taken out on this home.
Original Mortgage
$220,000
Outstanding Balance
$194,795
Interest Rate
3.6%
Mortgage Type
VA
Estimated Equity
$153,383
Purchase Details
Closed on
Nov 26, 1996
Sold by
Ballard Roy Cynthia
Bought by
Jones Melvin Veronica
Purchase Details
Closed on
Apr 5, 1994
Sold by
Contract G A Elec
Bought by
Ballard Roy Cynthia
Home Financials for this Owner
Home Financials are based on the most recent Mortgage that was taken out on this home.
Original Mortgage
$133,900
Interest Rate
7.26%
Mortgage Type
VA
Create a Home Valuation Report for This Property
The Home Valuation Report is an in-depth analysis detailing your home's value as well as a comparison with similar homes in the area
Home Values in the Area
Average Home Value in this Area
Purchase History
| Date | Buyer | Sale Price | Title Company |
|---|---|---|---|
| Cory Lakita | $220,000 | -- | |
| Corey Lakita | -- | -- | |
| Jones Melvin Veronica | $145,000 | -- | |
| Ballard Roy Cynthia | $130,000 | -- |
Source: Public Records
Mortgage History
| Date | Status | Borrower | Loan Amount |
|---|---|---|---|
| Open | Corey Lakita | $220,000 | |
| Previous Owner | Ballard Roy Cynthia | $133,900 | |
| Closed | Jones Melvin Veronica | $0 |
Source: Public Records
Tax History Compared to Growth
Tax History
| Year | Tax Paid | Tax Assessment Tax Assessment Total Assessment is a certain percentage of the fair market value that is determined by local assessors to be the total taxable value of land and additions on the property. | Land | Improvement |
|---|---|---|---|---|
| 2024 | $3,079 | $125,920 | $22,320 | $103,600 |
| 2023 | $2,887 | $122,360 | $22,880 | $99,480 |
| 2022 | $4,291 | $104,800 | $21,720 | $83,080 |
| 2021 | $3,521 | $86,320 | $15,640 | $70,680 |
| 2020 | $3,341 | $78,000 | $15,960 | $62,040 |
| 2019 | $2,730 | $60,440 | $9,720 | $50,720 |
| 2018 | $2,742 | $60,440 | $9,720 | $50,720 |
| 2017 | $2,464 | $53,760 | $9,720 | $44,040 |
| 2016 | $2,464 | $53,760 | $9,720 | $44,040 |
| 2015 | $953 | $47,240 | $8,360 | $38,880 |
| 2014 | $717 | $41,880 | $7,200 | $34,680 |
| 2013 | -- | $57,760 | $10,840 | $46,920 |
Source: Public Records
Map
Nearby Homes
- 2335 Ettas Cir SE
- 2323 Benji Blvd SE
- 3226 Old Salem Rd SE
- 3111 Green Gate Way SE
- 3240 Somerset Ct SE
- 3210 Spring Way SE
- 3225 Haleys Way SE
- 3296 Haverhill Ct SE
- 2585 Westchester Way SE
- 3121 Baywood Ct
- 2638 Westchester Pkwy SE
- 3222 Haleys Way SE
- 3348 Concord Corner SE
- 3095 Brombley Dr SE
- 3205 Haleys Way SE
- 2052 Evergreen Dr SE
- 3113 Brians Creek Dr SE
- 3106 Brians Creek Dr SE
- 3306 Sams Way SE
- 3304 Sams Way SE
- 3308 Sams Way SE
- 3304 SE 3304 Sams Way SE
- 3304R 3304 Sams Way SE
- 3207 Lindas Cir SE
- 3205 Lindas Cir SE
- 3305 Sams Way SE
- 3310 Sams Way SE
- 3310 Sams Way SE Unit 2
- 3303 Sams Way SE
- 2339 Benji Blvd SE
- 0 Sams Way SE Unit 8181491
- 3307 Sams Way SE
- 3209 Lindas Cir SE
- 3203 Lindas Cir SE
- 3301 Sams Way SE
- 3309 Sam Way SE
- 0 Sam Way SE Unit 8673906
- 3309 Sams Way SE