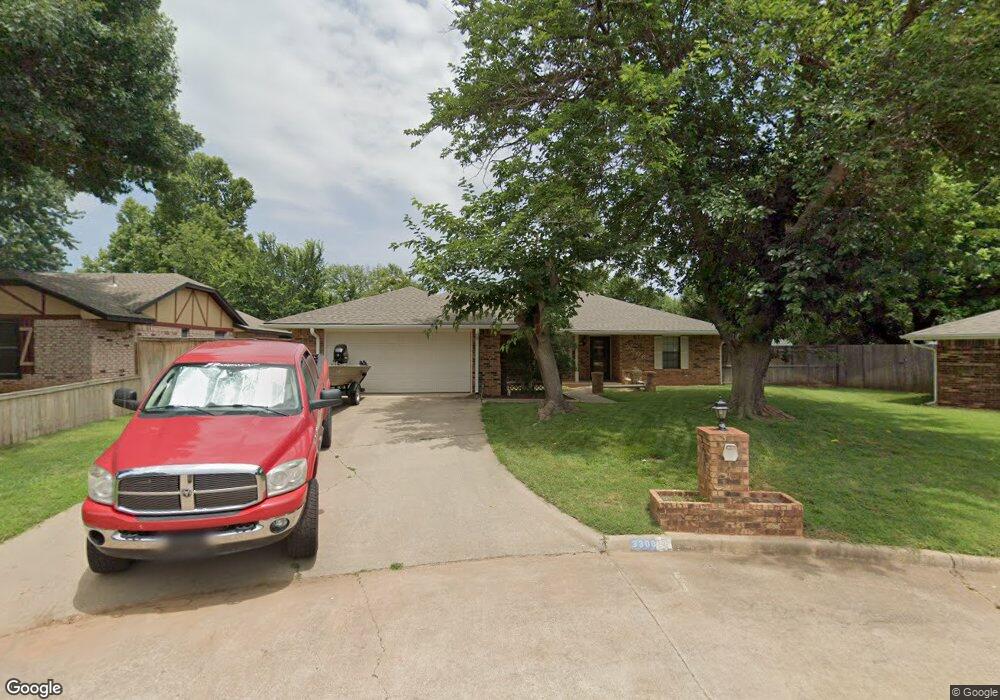
3306 Spencer Rd Duncan, OK 73533
Estimated Value: $192,452 - $225,000
3
Beds
2
Baths
1,898
Sq Ft
$110/Sq Ft
Est. Value
About This Home
This home is located at 3306 Spencer Rd, Duncan, OK 73533 and is currently estimated at $208,113, approximately $109 per square foot. 3306 Spencer Rd is a home with nearby schools including Plato Elementary School, Duncan Middle School, and Duncan High School.
Ownership History
Date
Name
Owned For
Owner Type
Purchase Details
Closed on
Feb 1, 2008
Sold by
Halliburton Real Estate Services Inc and Chase Deanna
Bought by
Stacker Walter Gregston and Stacker Delynn M
Current Estimated Value
Home Financials for this Owner
Home Financials are based on the most recent Mortgage that was taken out on this home.
Original Mortgage
$100,800
Outstanding Balance
$63,328
Interest Rate
6.07%
Mortgage Type
New Conventional
Estimated Equity
$144,785
Purchase Details
Closed on
Apr 29, 2005
Sold by
Wright Howard M and Wright Joan
Bought by
Etter Vance W and Etter Tracy
Home Financials for this Owner
Home Financials are based on the most recent Mortgage that was taken out on this home.
Original Mortgage
$114,000
Interest Rate
6.06%
Mortgage Type
VA
Purchase Details
Closed on
Apr 15, 1993
Sold by
Harvey Donald Floyd
Create a Home Valuation Report for This Property
The Home Valuation Report is an in-depth analysis detailing your home's value as well as a comparison with similar homes in the area
Purchase History
| Date | Buyer | Sale Price | Title Company |
|---|---|---|---|
| Stacker Walter Gregston | $126,000 | None Available | |
| Halliburton Real Estate Services Inc | $126,000 | None Available | |
| Etter Vance W | $114,000 | None Available | |
| -- | $82,500 | -- |
Source: Public Records
Mortgage History
| Date | Status | Borrower | Loan Amount |
|---|---|---|---|
| Open | Halliburton Real Estate Services Inc | $100,800 | |
| Closed | Stacker Walter Gregston | $100,800 | |
| Previous Owner | Etter Vance W | $114,000 |
Source: Public Records
Tax History
| Year | Tax Paid | Tax Assessment Tax Assessment Total Assessment is a certain percentage of the fair market value that is determined by local assessors to be the total taxable value of land and additions on the property. | Land | Improvement |
|---|---|---|---|---|
| 2025 | $1,432 | $16,979 | $933 | $16,046 |
| 2024 | $1,375 | $16,141 | $933 | $15,208 |
| 2023 | $1,375 | $16,141 | $933 | $15,208 |
| 2022 | $1,245 | $15,372 | $933 | $14,439 |
| 2021 | $1,187 | $13,943 | $933 | $13,010 |
| 2020 | $1,278 | $14,806 | $933 | $13,873 |
| 2019 | $1,241 | $14,343 | $933 | $13,410 |
| 2018 | $1,319 | $14,808 | $933 | $13,875 |
| 2017 | $1,252 | $14,564 | $933 | $13,631 |
| 2016 | $1,240 | $14,594 | $933 | $13,661 |
| 2015 | $1,145 | $14,022 | $933 | $13,089 |
| 2014 | $1,145 | $13,354 | $933 | $12,421 |
Source: Public Records
Map
Nearby Homes
- 3505 Spencer Rd
- 3202 Williamsburg St
- 805 Daryl Place
- 1209 Bent Tree St
- 2702 Wildwood Place
- 3710 Oakleaf Ct
- 2518 Wildwood Place
- 1705 Foxboro Dr
- 0 Clear Springs Dr
- 2324 N 7th St
- 2306 Northridge Dr
- 1108 1108 W Plato Unit 40
- 1108 W Plato Rd Unit 10
- 1108 W Plato Rd Unit 29
- 2209 Sunset Dr
- 0 Townsend St
- 2201 W Club Rd
- 2012 Park Dr
- 2001 Kingsbury Rd
- 4590 N 5th St
- 3310 Spencer Rd
- 3305 Robert Dr
- 3302 Spencer Rd
- 3309 Robert Dr
- 3402 Spencer Rd
- 3401 Robert Dr
- 3301 Robert Dr
- 3309 Spencer Rd
- 3301 Spencer Rd
- 3305 Spencer Rd
- 3406 Spencer Rd
- 3401 Spencer Rd
- 3405 Robert Dr
- 3208 N Country Club Rd
- 910 Clampitt Dr
- 3302 Robert Dr
- 3310 Robert Dr
- 3409 Robert Dr
- 3306 Robert Dr
- 3402 Robert Dr
Your Personal Tour Guide
Ask me questions while you tour the home.