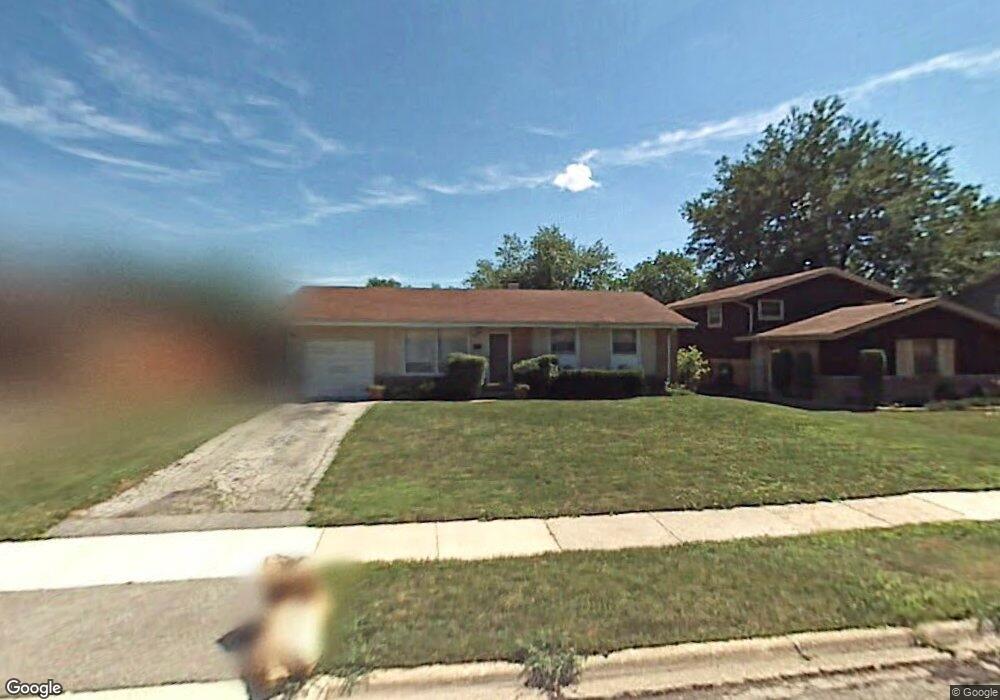
3307 Maple Ln Hazel Crest, IL 60429
Estimated Value: $181,000 - $266,000
3
Beds
2
Baths
1,246
Sq Ft
$167/Sq Ft
Est. Value
About This Home
This home is located at 3307 Maple Ln, Hazel Crest, IL 60429 and is currently estimated at $207,717, approximately $166 per square foot. 3307 Maple Ln is a home located in Cook County with nearby schools including Highlands Elementary School, Prairie-Hills Junior High School, and Hillcrest High School.
Ownership History
Date
Name
Owned For
Owner Type
Purchase Details
Closed on
Nov 8, 2002
Sold by
Desuze Susan
Bought by
Moy Don
Current Estimated Value
Home Financials for this Owner
Home Financials are based on the most recent Mortgage that was taken out on this home.
Original Mortgage
$99,439
Outstanding Balance
$41,174
Interest Rate
6.25%
Mortgage Type
FHA
Estimated Equity
$166,543
Purchase Details
Closed on
Jan 18, 2002
Sold by
Hud
Bought by
Desuze Susan
Home Financials for this Owner
Home Financials are based on the most recent Mortgage that was taken out on this home.
Original Mortgage
$45,500
Interest Rate
7.23%
Mortgage Type
Balloon
Purchase Details
Closed on
Sep 5, 2001
Sold by
Blakemore Phyllis and Blakemore Lamar
Bought by
Hud
Purchase Details
Closed on
Dec 29, 1997
Sold by
Simpson Jacqueline and Robinson Jacqueline
Bought by
Blakemore Phyllis
Home Financials for this Owner
Home Financials are based on the most recent Mortgage that was taken out on this home.
Original Mortgage
$69,530
Interest Rate
7.26%
Mortgage Type
FHA
Create a Home Valuation Report for This Property
The Home Valuation Report is an in-depth analysis detailing your home's value as well as a comparison with similar homes in the area
Home Values in the Area
Average Home Value in this Area
Purchase History
| Date | Buyer | Sale Price | Title Company |
|---|---|---|---|
| Moy Don | $101,000 | -- | |
| Desuze Susan | -- | -- | |
| Hud | -- | -- | |
| Blakemore Phyllis | $70,000 | -- |
Source: Public Records
Mortgage History
| Date | Status | Borrower | Loan Amount |
|---|---|---|---|
| Open | Moy Don | $99,439 | |
| Previous Owner | Desuze Susan | $45,500 | |
| Previous Owner | Blakemore Phyllis | $69,530 | |
| Closed | Desuze Susan | $13,000 |
Source: Public Records
Tax History
| Year | Tax Paid | Tax Assessment Tax Assessment Total Assessment is a certain percentage of the fair market value that is determined by local assessors to be the total taxable value of land and additions on the property. | Land | Improvement |
|---|---|---|---|---|
| 2025 | $5,474 | $14,000 | $2,340 | $11,660 |
| 2024 | $5,474 | $14,000 | $2,340 | $11,660 |
| 2023 | $3,927 | $14,000 | $2,340 | $11,660 |
| 2022 | $3,927 | $8,770 | $1,980 | $6,790 |
| 2021 | $3,849 | $8,770 | $1,980 | $6,790 |
| 2020 | $3,807 | $8,770 | $1,980 | $6,790 |
| 2019 | $3,473 | $8,617 | $1,800 | $6,817 |
| 2018 | $3,362 | $8,617 | $1,800 | $6,817 |
| 2017 | $3,178 | $8,617 | $1,800 | $6,817 |
| 2016 | $2,956 | $7,554 | $1,620 | $5,934 |
| 2015 | $2,762 | $7,554 | $1,620 | $5,934 |
| 2014 | $2,724 | $7,554 | $1,620 | $5,934 |
| 2013 | $2,828 | $8,534 | $1,620 | $6,914 |
Source: Public Records
Map
Nearby Homes
- 3312 Maple Ln
- 3319 Tulip Dr
- 3321 Tulip Dr
- 17113 Elm Dr
- 3318 Tulip Dr
- 17007 Elm Dr
- 3213 Woodworth Place
- 17206 Elm Dr
- 3511 Laurel Ln
- 3214 Birchwood Dr
- 17306 Burr Oak Ln
- 3321 173rd St
- 3316 Birchwood Dr
- 3311 Hickory Ln
- 3425 Birchwood Dr
- 17005 Albany Ave Unit 102
- 3012 171st St Unit GT
- 3509 Birchwood Dr
- 3107 173rd St
- 17006 Novak Dr Unit T107
Your Personal Tour Guide
Ask me questions while you tour the home.