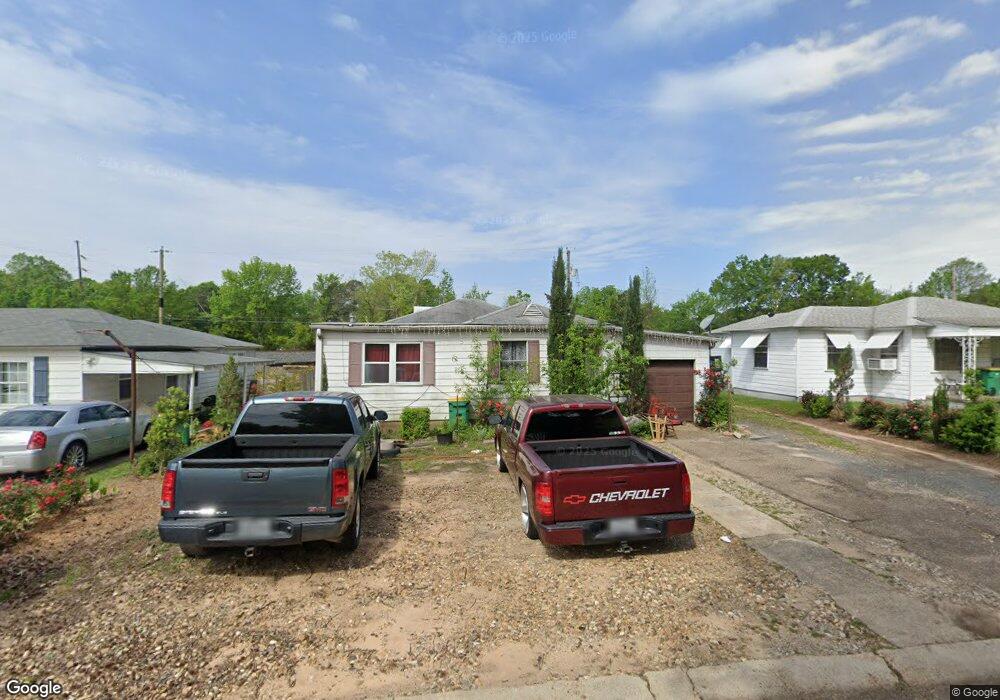
3307 Moore Dr Texarkana, TX 75503
Estimated Value: $92,516 - $104,000
--
Bed
--
Bath
1,270
Sq Ft
$76/Sq Ft
Est. Value
About This Home
This home is located at 3307 Moore Dr, Texarkana, TX 75503 and is currently estimated at $96,879, approximately $76 per square foot. 3307 Moore Dr is a home located in Bowie County with nearby schools including Highland Park Elementary School, Texas Middle School, and Texas High School.
Ownership History
Date
Name
Owned For
Owner Type
Purchase Details
Closed on
Oct 22, 2010
Sold by
Texarkana First Bank
Bought by
Mata Brijda
Current Estimated Value
Purchase Details
Closed on
Nov 10, 2005
Sold by
Easterling Douglas Lynn and Easterling Linda Gail
Bought by
Richard James L
Home Financials for this Owner
Home Financials are based on the most recent Mortgage that was taken out on this home.
Original Mortgage
$37,500
Interest Rate
5.9%
Create a Home Valuation Report for This Property
The Home Valuation Report is an in-depth analysis detailing your home's value as well as a comparison with similar homes in the area
Home Values in the Area
Average Home Value in this Area
Purchase History
| Date | Buyer | Sale Price | Title Company |
|---|---|---|---|
| Mata Brijda | -- | None Available | |
| Richard James L | -- | None Available |
Source: Public Records
Mortgage History
| Date | Status | Borrower | Loan Amount |
|---|---|---|---|
| Previous Owner | Richard James L | $37,500 |
Source: Public Records
Tax History Compared to Growth
Tax History
| Year | Tax Paid | Tax Assessment Tax Assessment Total Assessment is a certain percentage of the fair market value that is determined by local assessors to be the total taxable value of land and additions on the property. | Land | Improvement |
|---|---|---|---|---|
| 2025 | $1,244 | $54,284 | $6,500 | $47,784 |
| 2024 | $1,244 | $52,543 | $6,500 | $46,043 |
| 2023 | $1,167 | $49,301 | $6,500 | $42,801 |
| 2022 | $1,073 | $44,963 | $6,500 | $38,463 |
| 2021 | $1,003 | $39,206 | $6,500 | $32,706 |
| 2020 | $985 | $38,333 | $6,500 | $31,833 |
| 2019 | $984 | $36,871 | $6,500 | $30,371 |
| 2018 | $954 | $35,751 | $6,500 | $29,251 |
| 2017 | $936 | $35,202 | $6,500 | $28,702 |
| 2016 | $915 | $34,399 | $6,500 | $27,899 |
| 2015 | $933 | $33,375 | $6,500 | $26,875 |
| 2014 | $933 | $36,046 | $6,500 | $29,546 |
Source: Public Records
Map
Nearby Homes