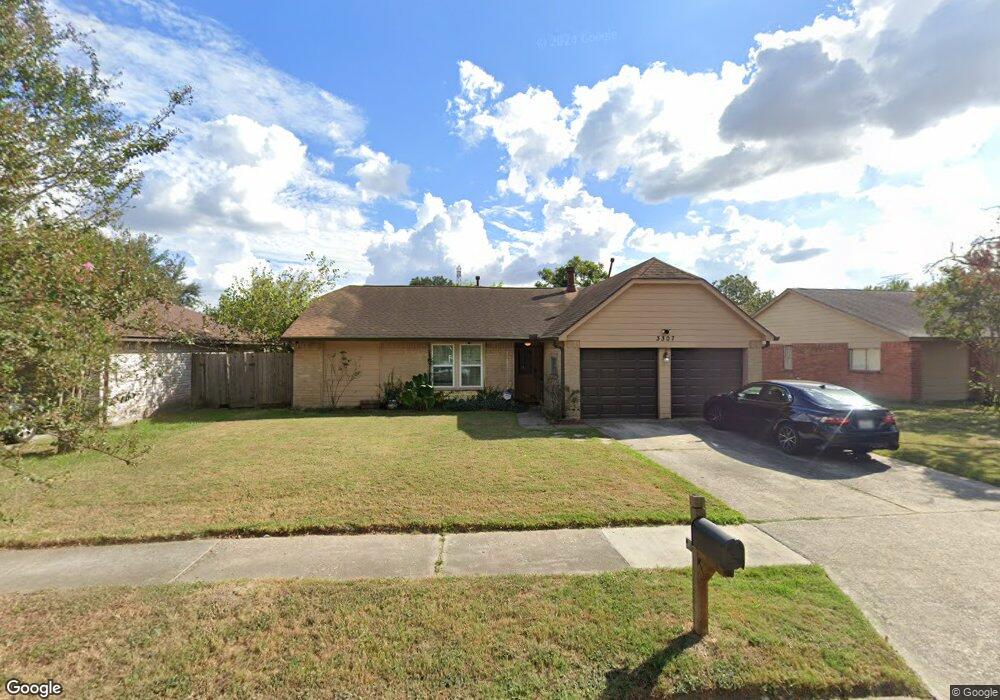
3307 Willow Tree Dr Houston, TX 77066
Champions NeighborhoodEstimated Value: $199,000 - $216,000
3
Beds
2
Baths
1,588
Sq Ft
$133/Sq Ft
Est. Value
About This Home
This home is located at 3307 Willow Tree Dr, Houston, TX 77066 and is currently estimated at $210,529, approximately $132 per square foot. 3307 Willow Tree Dr is a home located in Harris County with nearby schools including Griggs EC/PK/K, Conley Elementary School, and Plummer Middle School.
Ownership History
Date
Name
Owned For
Owner Type
Purchase Details
Closed on
Jul 8, 2023
Sold by
Gonzalez Jessica Michelle
Bought by
Gonzalez Benjamin
Current Estimated Value
Purchase Details
Closed on
Dec 21, 2001
Sold by
Salazar Roger
Bought by
Gonzalez Benjamin and Gonzalez Jessica M
Home Financials for this Owner
Home Financials are based on the most recent Mortgage that was taken out on this home.
Original Mortgage
$81,352
Interest Rate
6.41%
Mortgage Type
FHA
Purchase Details
Closed on
Oct 23, 2001
Sold by
Mudanyi Margaret K
Bought by
Salazar Roger
Home Financials for this Owner
Home Financials are based on the most recent Mortgage that was taken out on this home.
Original Mortgage
$81,352
Interest Rate
6.41%
Mortgage Type
FHA
Purchase Details
Closed on
Feb 8, 1997
Sold by
Mwangi Amos K
Bought by
Mudanyi Margaret K
Create a Home Valuation Report for This Property
The Home Valuation Report is an in-depth analysis detailing your home's value as well as a comparison with similar homes in the area
Home Values in the Area
Average Home Value in this Area
Purchase History
| Date | Buyer | Sale Price | Title Company |
|---|---|---|---|
| Gonzalez Benjamin | -- | None Listed On Document | |
| Gonzalez Benjamin | -- | First American Title | |
| Salazar Roger | -- | First American Title | |
| Mudanyi Margaret K | -- | -- |
Source: Public Records
Mortgage History
| Date | Status | Borrower | Loan Amount |
|---|---|---|---|
| Previous Owner | Gonzalez Benjamin | $81,352 |
Source: Public Records
Tax History Compared to Growth
Tax History
| Year | Tax Paid | Tax Assessment Tax Assessment Total Assessment is a certain percentage of the fair market value that is determined by local assessors to be the total taxable value of land and additions on the property. | Land | Improvement |
|---|---|---|---|---|
| 2025 | $2,380 | $195,186 | $37,868 | $157,318 |
| 2024 | $2,380 | $200,959 | $37,868 | $163,091 |
| 2023 | $2,380 | $224,257 | $37,868 | $186,389 |
| 2022 | $3,327 | $191,760 | $24,913 | $166,847 |
| 2021 | $3,206 | $156,920 | $24,913 | $132,007 |
| 2020 | $3,170 | $147,305 | $24,913 | $122,392 |
| 2019 | $3,001 | $125,650 | $13,287 | $112,363 |
| 2018 | $870 | $112,394 | $13,287 | $99,107 |
| 2017 | $2,408 | $112,394 | $13,287 | $99,107 |
| 2016 | $2,190 | $112,394 | $13,287 | $99,107 |
| 2015 | $1,461 | $98,887 | $13,287 | $85,600 |
| 2014 | $1,461 | $68,645 | $13,287 | $55,358 |
Source: Public Records
Map
Nearby Homes
- 14118 Magnolia Springs Dr
- 14003 Valley Grove Dr
- 3407 Sandbrook Dr
- 14207 Timberhaven Dr
- 13803 Bearwood Rd
- 3230 Hombly Rd
- 2919 Sunwood Dr
- 3240 Brownie Campbell Rd
- 2606 Owens Cross Dr
- 10915 Meadow Walk Ln
- 11322 Yorklyn Dr
- 12207 Mckamy Dr
- 2410 Irish Spring Dr
- 12114 Mckamy Dr
- 3519 Hombly Rd
- 12611 Landon Light Ln
- 2503 Hazyknoll Ln
- 2322 Hadden Hollow Dr
- 11335 Chelsea Walk Dr
- 2315 Tomlinson Trail Dr
- 3303 Willow Tree Dr
- 3311 Willow Tree Dr
- 3314 Creek Grove Dr
- 14006 Piney Run Ct
- 3315 Willow Tree Dr
- 14103 Magnolia Springs Dr
- 3318 Creek Grove Dr
- 3310 Willow Tree Dr
- 3314 Willow Tree Dr
- 3303 Creek Grove Dr
- 3307 Creek Grove Dr
- 14107 Magnolia Springs Dr
- 3322 Creek Grove Dr
- 14002 Piney Run Ct
- 3311 Creek Grove Dr
- 3318 Willow Tree Dr
- 14102 Magnolia Springs Dr
- 3327 Willow Tree Dr
- 3315 Creek Grove Dr
- 3326 Creek Grove Dr