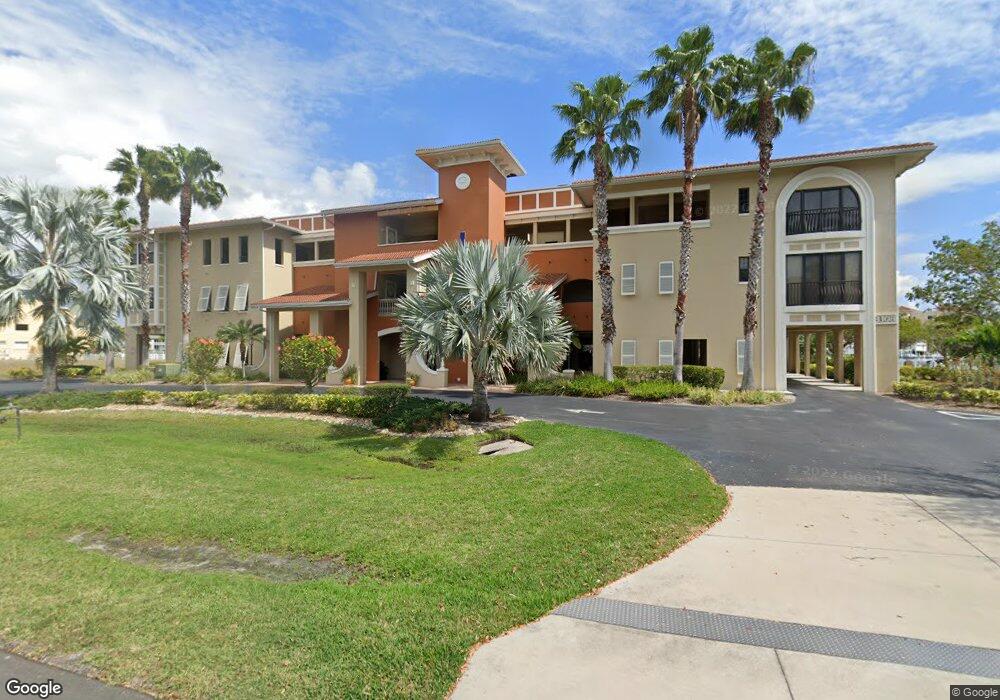
3308 Purple Martin Dr Unit 125 Punta Gorda, FL 33950
Punta Gorda Isles NeighborhoodEstimated Value: $357,164 - $477,000
3
Beds
2
Baths
1,850
Sq Ft
$219/Sq Ft
Est. Value
About This Home
This home is located at 3308 Purple Martin Dr Unit 125, Punta Gorda, FL 33950 and is currently estimated at $404,791, approximately $218 per square foot. 3308 Purple Martin Dr Unit 125 is a home located in Charlotte County with nearby schools including Sallie Jones Elementary School, Punta Gorda Middle School, and Charlotte High School.
Ownership History
Date
Name
Owned For
Owner Type
Purchase Details
Closed on
Sep 15, 2023
Sold by
Bower Susan M
Bought by
Bower Susan M
Current Estimated Value
Purchase Details
Closed on
Dec 26, 2007
Sold by
Sperry Pamela J
Bought by
Bower Steven R and Bower Susan M
Home Financials for this Owner
Home Financials are based on the most recent Mortgage that was taken out on this home.
Original Mortgage
$240,000
Interest Rate
6.15%
Mortgage Type
Purchase Money Mortgage
Purchase Details
Closed on
Apr 10, 2006
Sold by
Ksd Ii Partners Llc
Bought by
Sperry Pamela J
Home Financials for this Owner
Home Financials are based on the most recent Mortgage that was taken out on this home.
Original Mortgage
$395,200
Interest Rate
2%
Mortgage Type
Fannie Mae Freddie Mac
Create a Home Valuation Report for This Property
The Home Valuation Report is an in-depth analysis detailing your home's value as well as a comparison with similar homes in the area
Home Values in the Area
Average Home Value in this Area
Purchase History
| Date | Buyer | Sale Price | Title Company |
|---|---|---|---|
| Bower Susan M | $100 | None Listed On Document | |
| Bower Steven R | $300,000 | Chelsea Title Company | |
| Sperry Pamela J | $494,000 | Title Professionals Of Fl |
Source: Public Records
Mortgage History
| Date | Status | Borrower | Loan Amount |
|---|---|---|---|
| Previous Owner | Bower Steven R | $240,000 | |
| Previous Owner | Sperry Pamela J | $395,200 |
Source: Public Records
Tax History Compared to Growth
Tax History
| Year | Tax Paid | Tax Assessment Tax Assessment Total Assessment is a certain percentage of the fair market value that is determined by local assessors to be the total taxable value of land and additions on the property. | Land | Improvement |
|---|---|---|---|---|
| 2025 | $2,363 | $175,729 | -- | -- |
| 2024 | $2,296 | $170,776 | -- | -- |
| 2023 | $2,296 | $165,802 | $0 | $0 |
| 2022 | $2,273 | $160,973 | $0 | $0 |
| 2021 | $2,189 | $156,284 | $0 | $0 |
| 2020 | $2,092 | $154,126 | $0 | $0 |
| 2019 | $2,052 | $150,661 | $0 | $0 |
| 2018 | $1,885 | $147,852 | $0 | $0 |
| 2017 | $1,847 | $144,811 | $0 | $0 |
| 2016 | $1,837 | $141,833 | $0 | $0 |
| 2015 | $1,855 | $140,847 | $0 | $0 |
| 2014 | $1,852 | $139,729 | $0 | $0 |
Source: Public Records
Map
Nearby Homes
- 3242 Purple Martin Dr
- 3232 Purple Martin Dr
- 3322 Purple Martin Dr Unit 126
- 3322 Purple Martin Dr Unit 127
- 3228 Purple Martin Dr Unit 116
- 3228 Purple Martin Dr Unit 113
- 3233 Purple Martin Dr Unit 122
- 3323 Purple Martin Dr
- 3334 Purple Martin Dr Unit 214
- 3216 Purple Martin Dr Unit 121
- 3216 Purple Martin Dr Unit 123
- 3216 Purple Martin Dr Unit 122
- 3227 Purple Martin Dr
- 3335 Purple Martin Dr Unit 6
- 3335 Purple Martin Dr Unit 1
- 1461 Aqui Esta Dr Unit B3
- 3339 Purple Martin Dr
- 3234 Wood Thrush Dr
- 3314 Wood Thrush Dr Unit 124
- 1531 Aqui Esta Dr Unit 1
- 3308 Purple Martin Dr Unit 136
- 3308 Purple Martin Dr Unit 135
- 3308 Purple Martin Dr Unit 134
- 3308 Purple Martin Dr Unit 133
- 3308 Purple Martin Dr Unit 132
- 3308 Purple Martin Dr Unit 131
- 3308 Purple Martin Dr Unit 124
- 3308 Purple Martin Dr Unit 123
- 3308 Purple Martin Dr Unit 122
- 3308 Drive
- 3340 Purple Martin Dr
- 3322 Purple Martin Dr Unit 145
- 3322 Purple Martin Dr Unit 144
- 3322 Purple Martin Dr Unit 143
- 3322 Purple Martin Dr Unit 142
- 3322 Purple Martin Dr Unit 141
- 3322 Purple Martin Dr Unit 137
- 3322 Purple Martin Dr Unit 136
- 3322 Purple Martin Dr Unit 135