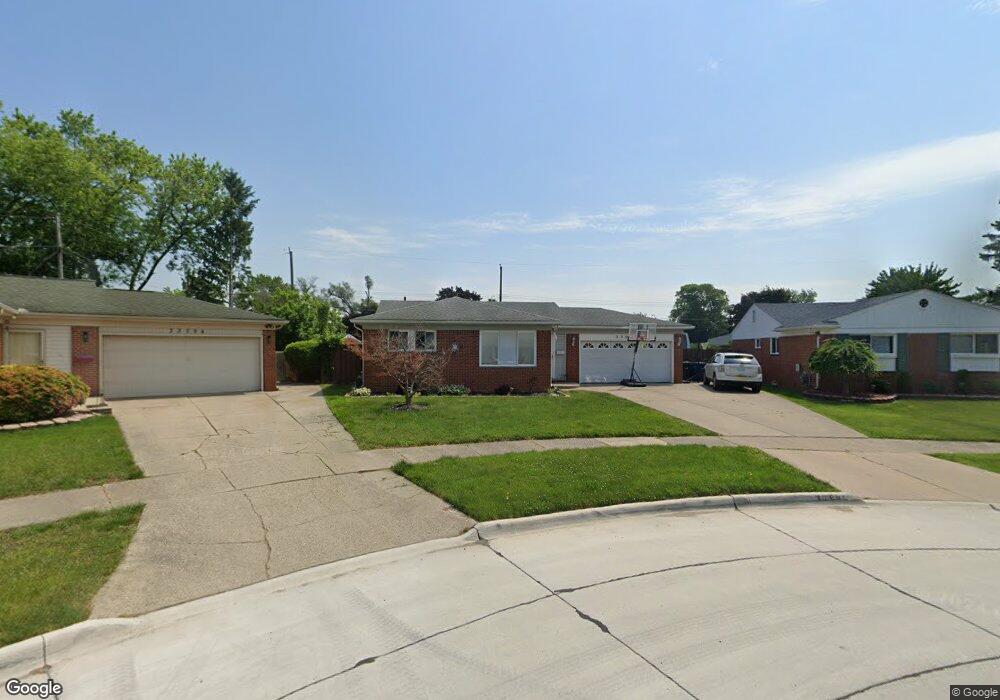
33088 Chief Ln Unit Bldg-Unit Westland, MI 48185
Estimated Value: $265,000 - $275,000
--
Bed
2
Baths
1,192
Sq Ft
$228/Sq Ft
Est. Value
About This Home
This home is located at 33088 Chief Ln Unit Bldg-Unit, Westland, MI 48185 and is currently estimated at $272,094, approximately $228 per square foot. 33088 Chief Ln Unit Bldg-Unit is a home located in Wayne County with nearby schools including Thomas A. Edison Elementary School, Marshall Upper Elementary School, and Adlai Stevenson Middle School.
Ownership History
Date
Name
Owned For
Owner Type
Purchase Details
Closed on
Feb 7, 2018
Sold by
Scott Stiegemer Danielle and Scott Stiegemer
Bought by
Ismair Yousef
Current Estimated Value
Home Financials for this Owner
Home Financials are based on the most recent Mortgage that was taken out on this home.
Original Mortgage
$162,993
Outstanding Balance
$142,905
Interest Rate
5.5%
Mortgage Type
FHA
Estimated Equity
$129,189
Purchase Details
Closed on
Aug 3, 2011
Sold by
U S Bank N A
Bought by
Department Of Veteranz Affairs
Purchase Details
Closed on
Mar 30, 2011
Sold by
Gazdag Ernest L and Gazdag Shirley M
Bought by
Us Bank Na
Purchase Details
Closed on
May 23, 1996
Sold by
Gaz Ernest L and Gaz Shirley M
Bought by
Rickey R Respondek
Purchase Details
Closed on
May 31, 1995
Sold by
Robert R Luttermoser
Bought by
Rickey R Respondek
Create a Home Valuation Report for This Property
The Home Valuation Report is an in-depth analysis detailing your home's value as well as a comparison with similar homes in the area
Home Values in the Area
Average Home Value in this Area
Purchase History
| Date | Buyer | Sale Price | Title Company |
|---|---|---|---|
| Ismair Yousef | $166,000 | Reputation First Title Agcy | |
| Department Of Veteranz Affairs | -- | None Available | |
| Us Bank Na | $77,555 | None Available | |
| Rickey R Respondek | $160,000 | -- | |
| Rickey R Respondek | $124,900 | -- |
Source: Public Records
Mortgage History
| Date | Status | Borrower | Loan Amount |
|---|---|---|---|
| Open | Ismair Yousef | $162,993 |
Source: Public Records
Tax History Compared to Growth
Tax History
| Year | Tax Paid | Tax Assessment Tax Assessment Total Assessment is a certain percentage of the fair market value that is determined by local assessors to be the total taxable value of land and additions on the property. | Land | Improvement |
|---|---|---|---|---|
| 2025 | $4,111 | $124,000 | $0 | $0 |
| 2024 | $4,111 | $114,500 | $0 | $0 |
| 2023 | $4,235 | $99,900 | $0 | $0 |
| 2022 | $4,792 | $89,800 | $0 | $0 |
| 2021 | $5,485 | $85,700 | $0 | $0 |
| 2020 | $3,975 | $78,800 | $0 | $0 |
| 2019 | $4,347 | $76,500 | $0 | $0 |
| 2018 | $2,324 | $68,400 | $0 | $0 |
| 2017 | $1,120 | $65,700 | $0 | $0 |
| 2016 | $2,977 | $66,400 | $0 | $0 |
| 2015 | $5,752 | $60,040 | $0 | $0 |
| 2013 | $5,572 | $59,610 | $0 | $0 |
| 2012 | $3,521 | $56,490 | $0 | $0 |
Source: Public Records
Map
Nearby Homes
- 33030 Cowan Rd
- 33652 Cowan Rd
- 6790 Emily Ct
- 32297 Warren Rd
- 33090 Woodworth Ct Unit 21
- 32106 Cambridge St
- 8433 Berwick Dr
- 6912 Moccasin St
- 33832 Lacrosse St
- 32238 Cambridge St
- 32687 Merritt Dr
- 34036 Pawnee St
- 34153 Warren Rd
- 7910 Nankin Mills St
- 31738 Rush St
- 32451 Sandra Ln
- 1812/ 1824 Imperial Hwy
- 37175 Russell Dr
- 32238 Meridian Dr
- 7814 Terri Dr
- 33088 Chief Ln
- 33094 Chief Ln
- 33082 Chief Ln
- 7401 Iroquois St
- 7415 Iroquois St
- 33076 Chief Ln
- 33100 Chief Ln
- 7429 Iroquois St
- 33083 Chief Ln
- 33095 Cowan Rd
- 7335 Iroquois St
- 33070 Chief Ln
- 33077 Chief Ln
- 33106 Chief Ln
- 7441 Iroquois St
- 33071 Chief Ln Unit Bldg-Unit
- 33071 Chief Ln
- 7321 Iroquois St
- 33064 Chief Ln
- 33117 Cowan Rd