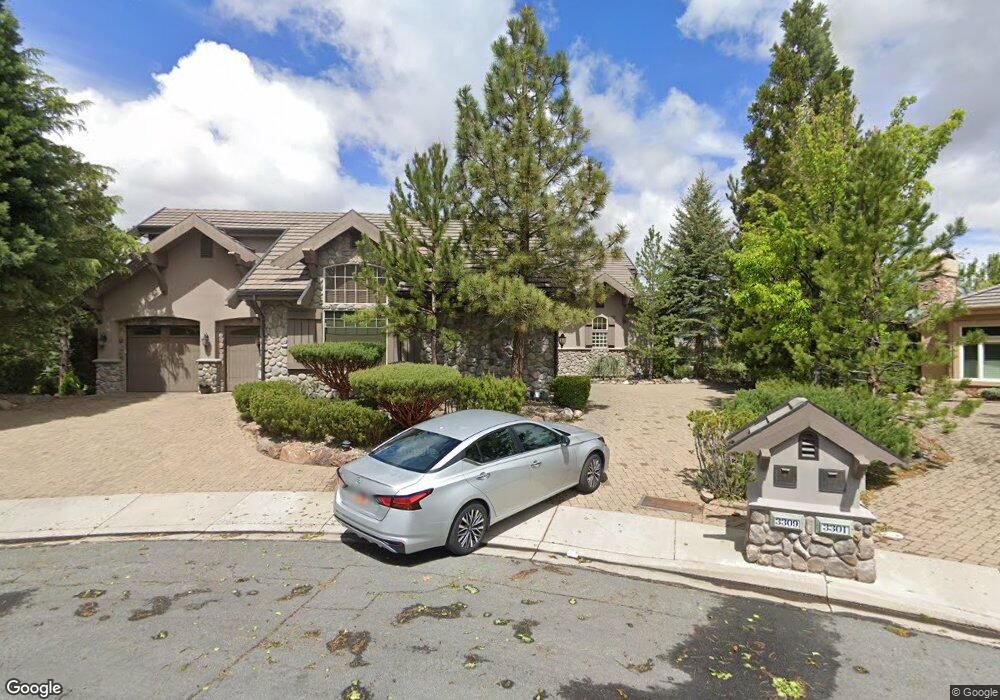
3309 Buckcreek Ct Unit 4 Reno, NV 89519
South Outer Reno NeighborhoodEstimated Value: $1,310,000 - $2,886,000
5
Beds
5
Baths
7,221
Sq Ft
$284/Sq Ft
Est. Value
About This Home
This home is located at 3309 Buckcreek Ct Unit 4, Reno, NV 89519 and is currently estimated at $2,049,215, approximately $283 per square foot. 3309 Buckcreek Ct Unit 4 is a home located in Washoe County with nearby schools including Caughlin Ranch Elementary School, Darrell C Swope Middle School, and Reno High School.
Ownership History
Date
Name
Owned For
Owner Type
Purchase Details
Closed on
May 26, 2005
Sold by
Maiss Alan and Maiss Nancy C
Bought by
Maiss Alan S and Maiss Nancy C
Current Estimated Value
Purchase Details
Closed on
Feb 26, 2002
Sold by
Brunson Tamara
Bought by
Brunson Tamara and The Tamara Brunson Family Trust
Purchase Details
Closed on
Oct 4, 2001
Sold by
Brunson Douglas C
Bought by
Brunson Tamara A
Home Financials for this Owner
Home Financials are based on the most recent Mortgage that was taken out on this home.
Original Mortgage
$490,000
Outstanding Balance
$184,244
Interest Rate
6.5%
Estimated Equity
$1,864,971
Purchase Details
Closed on
Aug 28, 2001
Sold by
Brunsonbuilt Const & Development Co Ltd
Bought by
Brunson Douglas C and Brunson Tamara A
Home Financials for this Owner
Home Financials are based on the most recent Mortgage that was taken out on this home.
Original Mortgage
$490,000
Outstanding Balance
$184,244
Interest Rate
6.5%
Estimated Equity
$1,864,971
Create a Home Valuation Report for This Property
The Home Valuation Report is an in-depth analysis detailing your home's value as well as a comparison with similar homes in the area
Home Values in the Area
Average Home Value in this Area
Purchase History
| Date | Buyer | Sale Price | Title Company |
|---|---|---|---|
| Maiss Alan S | -- | -- | |
| Brunson Tamara | -- | -- | |
| Brunson Tamara A | -- | -- | |
| Brunson Douglas C | $731,000 | First American Title |
Source: Public Records
Mortgage History
| Date | Status | Borrower | Loan Amount |
|---|---|---|---|
| Open | Brunson Douglas C | $490,000 |
Source: Public Records
Tax History Compared to Growth
Tax History
| Year | Tax Paid | Tax Assessment Tax Assessment Total Assessment is a certain percentage of the fair market value that is determined by local assessors to be the total taxable value of land and additions on the property. | Land | Improvement |
|---|---|---|---|---|
| 2025 | $15,279 | $491,467 | $85,190 | $406,277 |
| 2024 | $15,279 | $490,496 | $79,800 | $410,696 |
| 2023 | $11,119 | $464,387 | $81,060 | $383,327 |
| 2022 | $14,408 | $404,724 | $70,805 | $333,919 |
| 2021 | $13,988 | $397,469 | $67,060 | $330,409 |
| 2020 | $13,578 | $382,769 | $62,895 | $319,874 |
| 2019 | $13,183 | $375,938 | $57,575 | $318,363 |
| 2018 | $12,801 | $363,549 | $39,375 | $324,174 |
| 2017 | $12,427 | $357,815 | $34,405 | $323,410 |
| 2016 | $12,113 | $369,714 | $37,975 | $331,739 |
| 2015 | $12,091 | $370,356 | $30,975 | $339,381 |
| 2014 | $11,740 | $334,853 | $21,280 | $313,573 |
| 2013 | -- | $311,025 | $21,280 | $289,745 |
Source: Public Records
Map
Nearby Homes
- 4120 Flintlock Cir
- 4292 Caughlin Pkwy
- 1860 Hunter Creek Rd
- 3911 N Westpoint Dr
- 4229 Christy Way
- 4283 Water Hole Rd
- 60 Promontory Pointe
- 1720 Hunter Creek Rd Unit 5
- 4315 Water Hole Rd
- 1005 Stag Ridge Ct Unit 5
- 3332 Deer Ridge Ct
- 4840 Keshmiri Place
- 1570 Caughlin Creek Rd
- 3790 Ranch Crest Dr
- 3678 Brighton Way
- 30 Francovich Ct
- 3744 Ranch Crest Dr Unit 1
- 4940 Turning Leaf Way Unit 3
- 1074 Waverly Dr
- 4732 Cedarhill Ln
- 3301 Buckcreek Ct
- 3317 Buckcreek Ct
- 3325 Buckcreek Ct
- 3316 Buckcreek Ct
- 3308 Buckcreek Ct
- 3324 Buckcreek Ct
- 3333 Buckcreek Ct
- 4250 Caughlin Pkwy
- 4256 Caughlin Pkwy
- 3332 Buckcreek Ct
- 3341 Buckcreek Dr
- 4260 Caughlin Pkwy Unit 4
- 3340 Buckcreek Ct
- 3321 Ponderosa Pine Ct
- 3311 Ponderosa Pine Ct
- 3245 Sierra Crest Way
- 3265 Sierra Crest Way
- 4266 Caughlin Pkwy
- 3301 Ponderosa Pine Ct Unit 3
- 3349 Buckcreek Dr