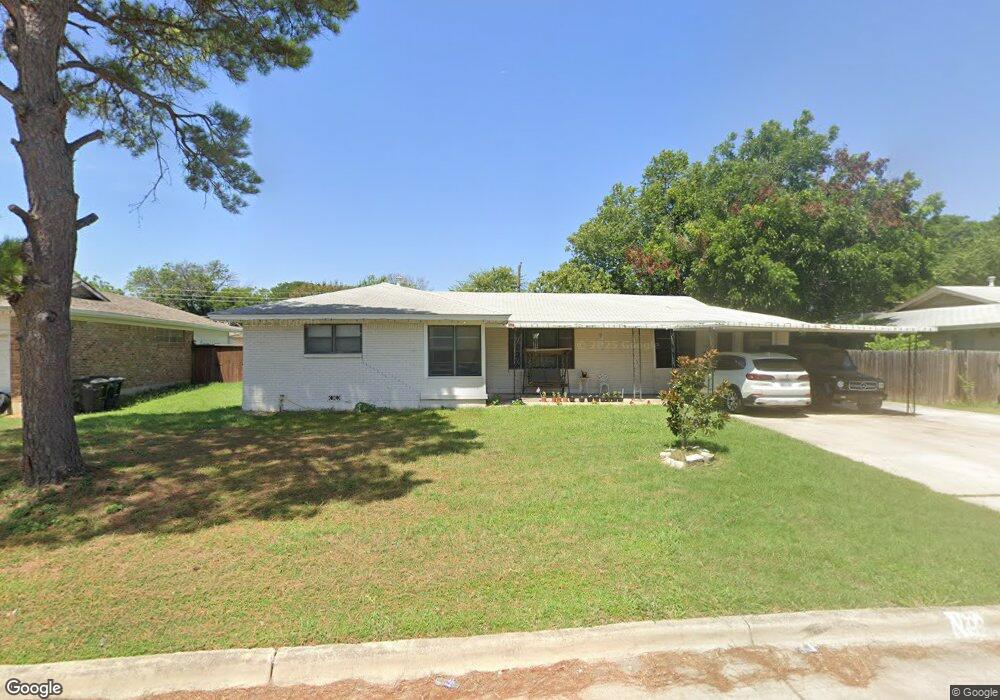
3309 Mesquite Rd Fort Worth, TX 76111
Estimated Value: $290,000 - $342,000
3
Beds
2
Baths
2,327
Sq Ft
$137/Sq Ft
Est. Value
About This Home
This home is located at 3309 Mesquite Rd, Fort Worth, TX 76111 and is currently estimated at $319,018, approximately $137 per square foot. 3309 Mesquite Rd is a home located in Tarrant County with nearby schools including Bonnie Brae, Riverside Middle School, and Carter-Riverside High School.
Ownership History
Date
Name
Owned For
Owner Type
Purchase Details
Closed on
Mar 11, 2019
Sold by
Koevilavong Savang and Lounavong Xaypaseuth
Bought by
Savang Koevilavong and Koevilavong Hatsakhone
Current Estimated Value
Home Financials for this Owner
Home Financials are based on the most recent Mortgage that was taken out on this home.
Original Mortgage
$91,000
Outstanding Balance
$58,756
Interest Rate
4.4%
Mortgage Type
New Conventional
Estimated Equity
$260,262
Purchase Details
Closed on
Jul 21, 2008
Sold by
Baccam Yanto and Baccam Chanpheng
Bought by
Keovilavong Savang and Lounavong Xaypaseuth
Home Financials for this Owner
Home Financials are based on the most recent Mortgage that was taken out on this home.
Original Mortgage
$98,455
Interest Rate
6.36%
Mortgage Type
Purchase Money Mortgage
Create a Home Valuation Report for This Property
The Home Valuation Report is an in-depth analysis detailing your home's value as well as a comparison with similar homes in the area
Home Values in the Area
Average Home Value in this Area
Purchase History
| Date | Buyer | Sale Price | Title Company |
|---|---|---|---|
| Savang Koevilavong | -- | None Available | |
| Keovilavong Savang | -- | Alamo Title Company |
Source: Public Records
Mortgage History
| Date | Status | Borrower | Loan Amount |
|---|---|---|---|
| Open | Savang Koevilavong | $91,000 | |
| Closed | Keovilavong Savang | $98,455 |
Source: Public Records
Tax History Compared to Growth
Tax History
| Year | Tax Paid | Tax Assessment Tax Assessment Total Assessment is a certain percentage of the fair market value that is determined by local assessors to be the total taxable value of land and additions on the property. | Land | Improvement |
|---|---|---|---|---|
| 2025 | $3,326 | $327,006 | $31,800 | $295,206 |
| 2024 | $3,326 | $327,006 | $31,800 | $295,206 |
| 2023 | $4,441 | $306,333 | $31,800 | $274,533 |
| 2022 | $4,638 | $222,578 | $22,260 | $200,318 |
| 2021 | $4,450 | $193,233 | $14,000 | $179,233 |
| 2020 | $3,903 | $179,206 | $14,000 | $165,206 |
| 2019 | $3,688 | $156,752 | $14,000 | $142,752 |
| 2018 | $2,823 | $121,869 | $14,000 | $107,869 |
| 2017 | $3,139 | $110,790 | $14,000 | $96,790 |
| 2016 | $3,841 | $135,566 | $14,000 | $121,566 |
| 2015 | $2,705 | $95,300 | $14,100 | $81,200 |
| 2014 | $2,705 | $95,300 | $14,100 | $81,200 |
Source: Public Records
Map
Nearby Homes
- 3213 Mesquite Rd
- 3301 Hedrick St
- 3328 Hedrick St
- 3416 Hedrick St
- 3409 Gay St
- 3201 Lakeland St
- 3560 Regal Rd
- 3212 Bonnie Brae Ave
- 3217 Edith Ln
- 3137 Eastridge Dr
- 2841 Pacifico Way
- 3420 Tommy Watkins Dr
- 3509 Tommy Hays Dr
- 4201 Mckibben St
- 3308 NE 29th St
- 4208 Patricia St
- 4313 Conkling Ave
- 3509 Glenda St
- 3012 Gene Ln
- 4404 Mckibben St
- 3305 Mesquite Rd
- 3313 Mesquite Rd
- 3304 Wesley St
- 3308 Wesley St
- 3300 Wesley St
- 3308 Mesquite Rd
- 3317 Mesquite Rd
- 3312 Wesley St
- 3301 Mesquite Rd
- 3304 Mesquite Rd
- 3312 Mesquite Rd
- 3316 Wesley St
- 3316 Mesquite Rd
- 3321 Mesquite Rd
- 3300 Mesquite Rd
- 3220 Wesley St
- 3309 Wesley St
- 3301 Wesley St
- 3320 Wesley St
- 3313 Wesley St