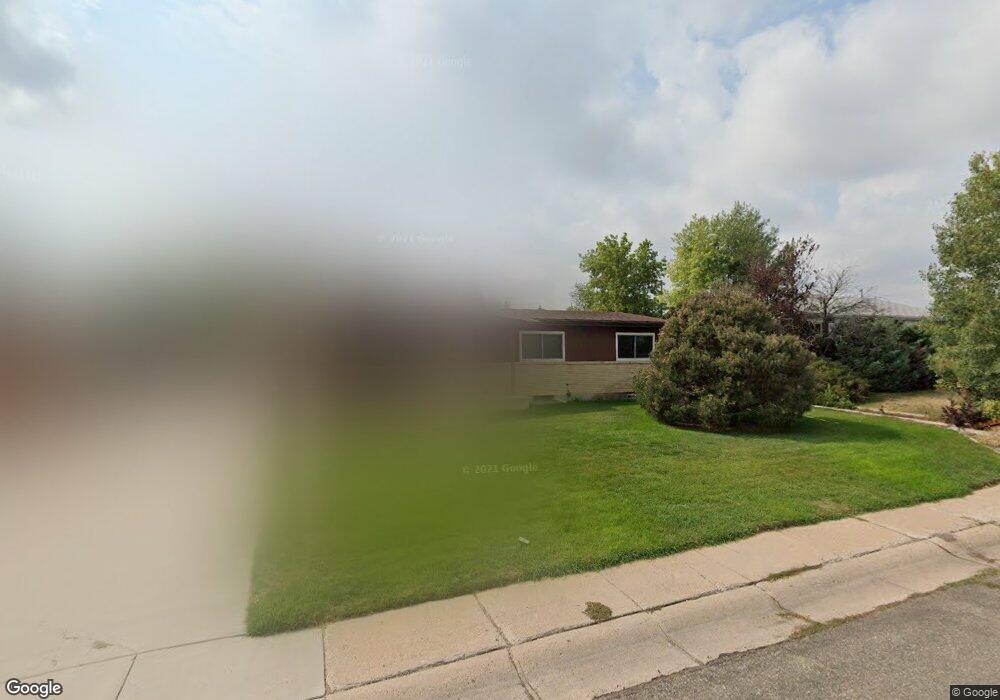
3309 Morrison Ct Cheyenne, WY 82001
Estimated Value: $300,000 - $347,000
Studio
--
Bath
1,125
Sq Ft
$293/Sq Ft
Est. Value
About This Home
This home is located at 3309 Morrison Ct, Cheyenne, WY 82001 and is currently estimated at $329,143, approximately $292 per square foot. 3309 Morrison Ct is a home located in Laramie County with nearby schools including Baggs Elementary School, Carey Junior High School, and East High School.
Ownership History
Date
Name
Owned For
Owner Type
Purchase Details
Closed on
Sep 6, 2012
Sold by
Bitner Brandi
Bought by
Bitner Brandi and Bitner David W
Current Estimated Value
Home Financials for this Owner
Home Financials are based on the most recent Mortgage that was taken out on this home.
Original Mortgage
$129,400
Outstanding Balance
$89,201
Interest Rate
3.49%
Mortgage Type
New Conventional
Estimated Equity
$239,942
Purchase Details
Closed on
May 25, 2004
Sold by
Kaiser Brandi and Bitner Brandi
Bought by
Bitner David W and Bitner Brandi
Home Financials for this Owner
Home Financials are based on the most recent Mortgage that was taken out on this home.
Original Mortgage
$45,000
Interest Rate
5.97%
Mortgage Type
Credit Line Revolving
Purchase Details
Closed on
Jul 29, 2002
Sold by
Johnson Dennis R and Johnson Deborah L
Bought by
Kaiser Brandi
Home Financials for this Owner
Home Financials are based on the most recent Mortgage that was taken out on this home.
Original Mortgage
$108,000
Interest Rate
6.62%
Create a Home Valuation Report for This Property
The Home Valuation Report is an in-depth analysis detailing your home's value as well as a comparison with similar homes in the area
Purchase History
| Date | Buyer | Sale Price | Title Company |
|---|---|---|---|
| Bitner Brandi | -- | -- | |
| Bitner Brandi | -- | -- | |
| Bitner Brandi | -- | -- | |
| Bitner Brandi | -- | -- | |
| Bitner David W | -- | -- | |
| Kaiser Brandi | -- | -- |
Source: Public Records
Mortgage History
| Date | Status | Borrower | Loan Amount |
|---|---|---|---|
| Open | Bitner Brandi | $129,400 | |
| Closed | Bitner Brandi | $129,400 | |
| Previous Owner | Bitner David W | $45,000 | |
| Previous Owner | Kaiser Brandi | $108,000 |
Source: Public Records
Tax History
| Year | Tax Paid | Tax Assessment Tax Assessment Total Assessment is a certain percentage of the fair market value that is determined by local assessors to be the total taxable value of land and additions on the property. | Land | Improvement |
|---|---|---|---|---|
| 2025 | $2,243 | $24,333 | $2,513 | $21,820 |
| 2024 | $2,243 | $31,723 | $3,351 | $28,372 |
| 2023 | $2,176 | $30,768 | $3,351 | $27,417 |
| 2022 | $1,905 | $26,389 | $3,351 | $23,038 |
| 2021 | $1,776 | $24,546 | $3,043 | $21,503 |
| 2020 | $1,573 | $21,802 | $3,043 | $18,759 |
| 2019 | $1,449 | $20,066 | $3,043 | $17,023 |
| 2018 | $1,346 | $18,819 | $3,043 | $15,776 |
| 2017 | $1,256 | $17,404 | $3,043 | $14,361 |
| 2016 | $1,151 | $15,944 | $2,902 | $13,042 |
| 2015 | $1,115 | $15,434 | $2,902 | $12,532 |
| 2014 | $1,150 | $15,822 | $2,902 | $12,920 |
Source: Public Records
Map
Nearby Homes
- 3316 Rock Springs St
- 3901 Ridge Rd Unit 57
- TBD Rock Springs St
- 3317 Laramie St
- 3519 Birch Place
- 3711 Rawlins St
- 4320 Ridge Rd
- 3410 Ridge Rd
- 3802 Mccann Ave
- TBD Lot 4 Ridge Rd
- TBD LOT 3 Ridge Rd
- TBD Lot 2 Ridge Rd
- 134 Rio Verde Cir
- 3820 E Pershing Blvd
- Lot 1 Block 2 N College Dr
- Lot 1 Block 1 N College Dr
- 4761 Greybull Ave
- 4202 & 4204 Cheyenne St
- 4783 Cole Place
- 3513 Holmes St
- 3303 Morrison Ct
- 3315 Morrison Ct
- 3229 Morrison Ct
- 3310 Rawlins St
- 3316 Rawlins St
- 3304 Rawlins St
- 3322 Rawlins St
- 3310 Morrison Ct
- 3223 Morrison Ct
- 3316 Morrison Ct
- 3304 Morrison Ct
- 3230 Rawlins St
- 3902 Ridge Rd
- 3230 Morrison Ct
- 3217 Morrison Ct
- 3224 Morrison Ct
- 3224 Rawlins St
- 3218 Morrison Ct
- 3801 Ridge Rd Unit 40
- 3801 Ridge Rd
Your Personal Tour Guide
Ask me questions while you tour the home.