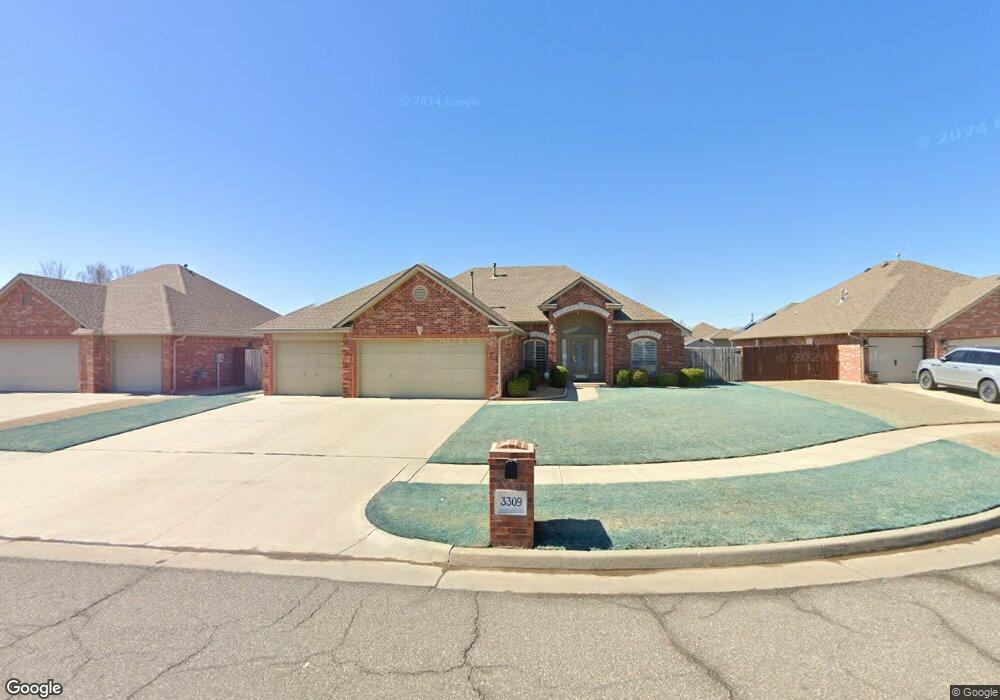
3309 Red Maple Ln Oklahoma City, OK 73170
Oakridge-Southmoore NeighborhoodEstimated Value: $292,814 - $320,000
3
Beds
2
Baths
1,919
Sq Ft
$160/Sq Ft
Est. Value
About This Home
This home is located at 3309 Red Maple Ln, Oklahoma City, OK 73170 and is currently estimated at $306,204, approximately $159 per square foot. 3309 Red Maple Ln is a home located in Cleveland County with nearby schools including Oakridge Elementary School, Southmoore High School, and Redbud Farm and Christian School.
Ownership History
Date
Name
Owned For
Owner Type
Purchase Details
Closed on
Jun 15, 2012
Sold by
Keahbone Mike and Keahbone Jennifer
Bought by
Chong Willie
Current Estimated Value
Home Financials for this Owner
Home Financials are based on the most recent Mortgage that was taken out on this home.
Original Mortgage
$167,400
Outstanding Balance
$116,177
Interest Rate
3.86%
Mortgage Type
New Conventional
Estimated Equity
$190,027
Purchase Details
Closed on
Dec 31, 2008
Sold by
Tompkins Rodney R and Tompkins Maegan M
Bought by
Keahbone Mike
Home Financials for this Owner
Home Financials are based on the most recent Mortgage that was taken out on this home.
Original Mortgage
$184,520
Interest Rate
6.08%
Mortgage Type
New Conventional
Purchase Details
Closed on
Jul 28, 2004
Sold by
Harper John and Harper Debbie
Bought by
Mcgowin Jeremy D and Mcgowin Joshalyn S
Create a Home Valuation Report for This Property
The Home Valuation Report is an in-depth analysis detailing your home's value as well as a comparison with similar homes in the area
Home Values in the Area
Average Home Value in this Area
Purchase History
| Date | Buyer | Sale Price | Title Company |
|---|---|---|---|
| Chong Willie | $186,000 | Stewart Abstract & Title Of | |
| Keahbone Mike | $187,000 | The Oklahoma City Abstract & | |
| Mcgowin Jeremy D | $29,000 | -- |
Source: Public Records
Mortgage History
| Date | Status | Borrower | Loan Amount |
|---|---|---|---|
| Open | Chong Willie | $167,400 | |
| Previous Owner | Keahbone Mike | $184,520 |
Source: Public Records
Tax History Compared to Growth
Tax History
| Year | Tax Paid | Tax Assessment Tax Assessment Total Assessment is a certain percentage of the fair market value that is determined by local assessors to be the total taxable value of land and additions on the property. | Land | Improvement |
|---|---|---|---|---|
| 2024 | $2,831 | $24,339 | $4,662 | $19,677 |
| 2023 | $2,758 | $23,631 | $4,595 | $19,036 |
| 2022 | $2,714 | $22,942 | $4,461 | $18,481 |
| 2021 | $2,644 | $22,274 | $4,039 | $18,235 |
| 2020 | $2,688 | $21,625 | $3,360 | $18,265 |
| 2019 | $2,737 | $21,625 | $3,360 | $18,265 |
| 2018 | $2,740 | $21,626 | $3,360 | $18,266 |
| 2017 | $2,753 | $21,626 | $0 | $0 |
| 2016 | $2,773 | $21,626 | $3,360 | $18,266 |
| 2015 | $2,532 | $21,829 | $3,360 | $18,469 |
| 2014 | $2,572 | $21,658 | $3,360 | $18,298 |
Source: Public Records
Map
Nearby Homes
- 2037 Oak Dr
- 313 SW 166th St
- 500 SW 159th Terrace
- 520 SW 164th St
- 241 SW 166th St
- 16728 Serrano Dr
- 1402 SW 25th St
- 1312 SW 25th St
- 1848 SW 31st St
- 108 SW 167th St
- 809 SW 161st St
- 1413 SW 161st St
- 1606 Westmore Dr
- 16901 Picasso Dr
- 1513 SW 23rd St
- 1745 SW 31st Terrace
- 2401 Lakecrest Dr
- 300 SW 171st St
- 1741 SW 33rd St
- 725 Pleasant Dr
- 3313 Red Maple Ln
- 3305 Red Maple Ln
- 3300 Birch Dr
- 3304 Birch Dr
- 3208 Birch Dr
- 3317 Red Maple Ln
- 3301 Red Maple Ln
- 3308 Birch Dr
- 3308 Red Maple Ln
- 3312 Red Maple Ln
- 3304 Red Maple Ln
- 3204 Birch Dr
- 3321 Red Maple Ln
- 3316 Red Maple Ln
- 3300 Red Maple Ln
- 3320 Red Maple Ln
- 3305 Birch Dr
- 3301 Birch Dr
- 2224 Oak Dr
- 3305 Cypress Ct