
Seller's Agent in 2013
Stephanie Do
Do Realty Services, Inc.
(217) 241-2523
231 Total Sales


Estimated Value: $100,543 - $108,000
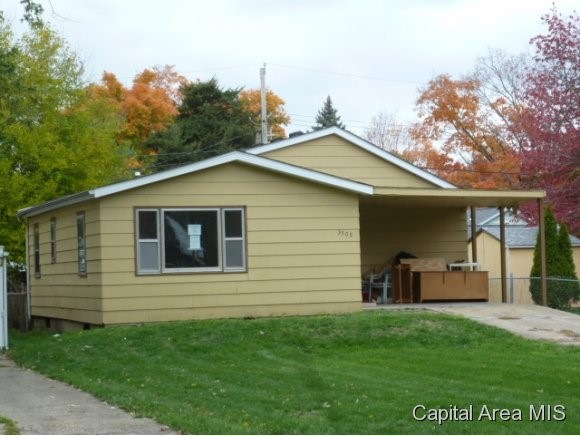
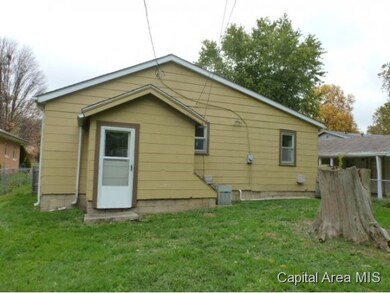
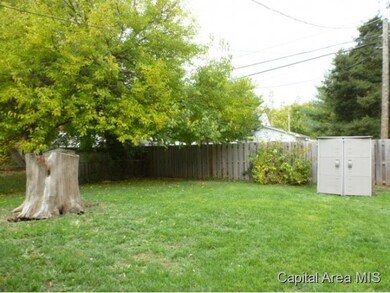
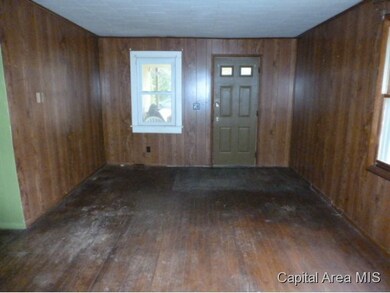
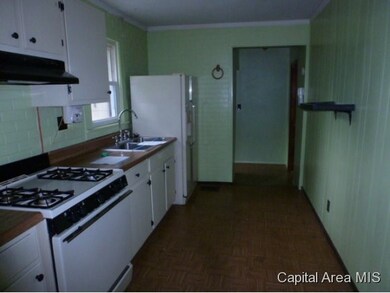
This home will surprise you - it's got alot going for it and at a great price. There's two bedrooms with hardwood floors, galley type kitchen with a separate dining room, living room and bath. There's an unfinished partial basement, a carport, nice size fenced backyard and a shed. Definitely worth a look, come check it out!
Last Agent to Sell the Property
Do Realty Services, Inc. License #471000834 Listed on: 11/03/2012
Last Buyer's Agent
DAVID SULLIVAN
IN BETWEEN OFFICES License #475123224
| Date | Buyer | Sale Price | Title Company |
|---|---|---|---|
| Champaign Investment Llc | $25,227 | Judicial Sales Corporation | |
| -- | $29,900 | -- | |
| -- | $56,700 | -- | |
| -- | -- | -- | |
| -- | $55,000 | -- | |
| -- | -- | -- |
| Date | Event | Price | List to Sale | Price per Sq Ft |
|---|---|---|---|---|
| 01/11/2013 01/11/13 | Sold | $29,900 | 0.0% | $31 / Sq Ft |
| 11/13/2012 11/13/12 | Pending | -- | -- | -- |
| 11/03/2012 11/03/12 | For Sale | $29,900 | -- | $31 / Sq Ft |
| Year | Tax Paid | Tax Assessment Tax Assessment Total Assessment is a certain percentage of the fair market value that is determined by local assessors to be the total taxable value of land and additions on the property. | Land | Improvement |
|---|---|---|---|---|
| 2024 | $2,131 | $27,126 | $5,105 | $22,021 |
| 2023 | $2,089 | $25,117 | $4,727 | $20,390 |
| 2022 | $2,005 | $23,769 | $4,473 | $19,296 |
| 2021 | $1,950 | $22,838 | $4,298 | $18,540 |
| 2020 | $1,881 | $22,589 | $4,251 | $18,338 |
| 2019 | $1,813 | $22,194 | $4,177 | $18,017 |
| 2018 | $1,750 | $22,099 | $4,159 | $17,940 |
| 2017 | $1,710 | $21,759 | $4,095 | $17,664 |
| 2016 | $1,658 | $21,197 | $3,989 | $17,208 |
| 2015 | $1,627 | $20,718 | $3,899 | $16,819 |
| 2014 | $1,600 | $20,546 | $3,867 | $16,679 |
| 2013 | $1,575 | $20,766 | $3,908 | $16,858 |
Seller's Agent in 2013
Stephanie Do
Do Realty Services, Inc.
(217) 241-2523
231 Total Sales
D
Buyer's Agent in 2013
DAVID SULLIVAN
IN BETWEEN OFFICES
Source: RMLS Alliance
MLS Number: RMACA125516
APN: 22-16.0-208-013
Disclaimer: Certain information contained herein is derived from information provided by parties other than Homes.com. All information provided is deemed reliable, but is not guaranteed to be accurate and should be independently verified.
![]() Based on information submitted to the MLS GRID. All data is obtained from various sources and may not have been verified by broker or MLS GRID. Supplied Open House Information is subject to change without notice. All information should be independently reviewed and verified for accuracy. Properties may or may not be listed by the office/agent presenting the information. Some IDX listings have been excluded from this website.IDX information is provided exclusively for personal, non-commercial use, and may not be used for any purpose other than to identify prospective properties consumers may be interested in purchasing. Information is deemed reliable but not guaranteed.
Based on information submitted to the MLS GRID. All data is obtained from various sources and may not have been verified by broker or MLS GRID. Supplied Open House Information is subject to change without notice. All information should be independently reviewed and verified for accuracy. Properties may or may not be listed by the office/agent presenting the information. Some IDX listings have been excluded from this website.IDX information is provided exclusively for personal, non-commercial use, and may not be used for any purpose other than to identify prospective properties consumers may be interested in purchasing. Information is deemed reliable but not guaranteed.
Based on information submitted to the MLS GRID
Ask me questions while you tour the home.