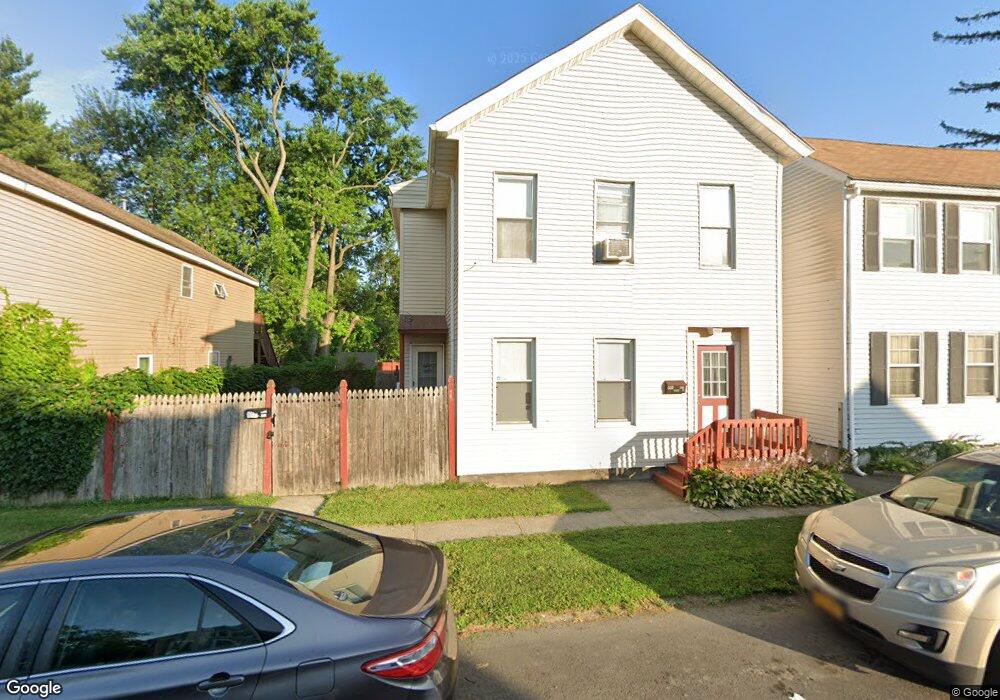
331 3rd Ave Unit 333 Troy, NY 12182
Lansingburgh NeighborhoodEstimated Value: $177,000 - $233,000
6
Beds
2
Baths
2,820
Sq Ft
$70/Sq Ft
Est. Value
About This Home
This home is located at 331 3rd Ave Unit 333, Troy, NY 12182 and is currently estimated at $197,103, approximately $69 per square foot. 331 3rd Ave Unit 333 is a home located in Rensselaer County with nearby schools including Turnpike Elementary School, Rensselaer Park Elementary School, and Knickerbacker Middle School.
Ownership History
Date
Name
Owned For
Owner Type
Purchase Details
Closed on
Oct 2, 2025
Sold by
Collins Paul W
Bought by
Paul W Collins T W and Paul Carhart
Current Estimated Value
Purchase Details
Closed on
Jan 20, 2006
Sold by
Ciry Of Troy New York
Bought by
Collins Paul W
Home Financials for this Owner
Home Financials are based on the most recent Mortgage that was taken out on this home.
Original Mortgage
$51,900
Interest Rate
6.33%
Mortgage Type
Purchase Money Mortgage
Purchase Details
Closed on
Nov 4, 2004
Sold by
Troy Realty Equity Corp
Bought by
Pallozzi Michael
Purchase Details
Closed on
Feb 20, 2001
Purchase Details
Closed on
Jan 18, 2001
Purchase Details
Closed on
May 25, 2000
Purchase Details
Closed on
Aug 11, 1998
Purchase Details
Closed on
Apr 17, 1998
Purchase Details
Closed on
Jan 14, 1998
Sold by
Hinman George
Bought by
Anderson Anthony J
Purchase Details
Closed on
Nov 15, 1996
Create a Home Valuation Report for This Property
The Home Valuation Report is an in-depth analysis detailing your home's value as well as a comparison with similar homes in the area
Home Values in the Area
Average Home Value in this Area
Purchase History
| Date | Buyer | Sale Price | Title Company |
|---|---|---|---|
| Paul W Collins T W | -- | -- | |
| Collins Paul W | $64,900 | None Listed | |
| Pallozzi Michael | -- | 'N/A' | |
| -- | -- | -- | |
| -- | -- | -- | |
| -- | -- | -- | |
| -- | -- | -- | |
| -- | -- | -- | |
| Anderson Anthony J | $48,000 | -- | |
| -- | $1,500 | -- |
Source: Public Records
Mortgage History
| Date | Status | Borrower | Loan Amount |
|---|---|---|---|
| Previous Owner | Collins Paul W | $51,900 |
Source: Public Records
Tax History
| Year | Tax Paid | Tax Assessment Tax Assessment Total Assessment is a certain percentage of the fair market value that is determined by local assessors to be the total taxable value of land and additions on the property. | Land | Improvement |
|---|---|---|---|---|
| 2024 | $3,793 | $83,000 | $14,000 | $69,000 |
| 2023 | $3,719 | $83,000 | $14,000 | $69,000 |
| 2022 | $3,619 | $83,000 | $14,000 | $69,000 |
| 2021 | $945 | $83,000 | $14,000 | $69,000 |
| 2020 | $1,711 | $83,000 | $14,000 | $69,000 |
| 2019 | $2,575 | $83,000 | $14,000 | $69,000 |
| 2018 | $2,575 | $83,000 | $14,000 | $69,000 |
| 2017 | $2,542 | $83,000 | $14,000 | $69,000 |
| 2016 | $3,435 | $83,000 | $14,000 | $69,000 |
| 2015 | -- | $83,000 | $14,000 | $69,000 |
| 2014 | -- | $83,000 | $14,000 | $69,000 |
Source: Public Records
Map
Nearby Homes
Your Personal Tour Guide
Ask me questions while you tour the home.