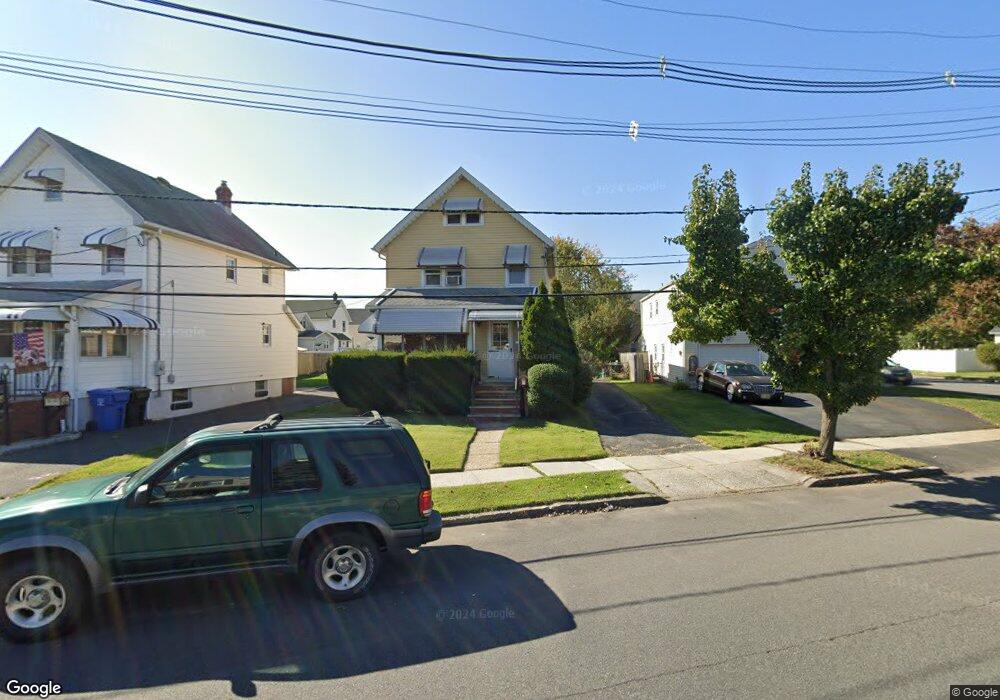
331 Berry St Woodbridge, NJ 07095
Estimated Value: $375,606 - $526,000
--
Bed
--
Bath
1,640
Sq Ft
$293/Sq Ft
Est. Value
About This Home
This home is located at 331 Berry St, Woodbridge, NJ 07095 and is currently estimated at $480,652, approximately $293 per square foot. 331 Berry St is a home located in Middlesex County with nearby schools including Ross Street Elementary School, Woodbridge Middle School, and Woodbridge High School.
Ownership History
Date
Name
Owned For
Owner Type
Purchase Details
Closed on
Sep 2, 2009
Sold by
Makar Leslie J
Bought by
Makar Shane M
Current Estimated Value
Home Financials for this Owner
Home Financials are based on the most recent Mortgage that was taken out on this home.
Original Mortgage
$214,692
Outstanding Balance
$138,035
Interest Rate
4.86%
Mortgage Type
FHA
Estimated Equity
$342,617
Purchase Details
Closed on
Nov 16, 2003
Sold by
Petro John F
Bought by
Makar Shane M and Makar Thomas J
Create a Home Valuation Report for This Property
The Home Valuation Report is an in-depth analysis detailing your home's value as well as a comparison with similar homes in the area
Home Values in the Area
Average Home Value in this Area
Purchase History
| Date | Buyer | Sale Price | Title Company |
|---|---|---|---|
| Makar Shane M | -- | None Available | |
| Makar Shane M | $227,500 | -- |
Source: Public Records
Mortgage History
| Date | Status | Borrower | Loan Amount |
|---|---|---|---|
| Open | Makar Shane M | $214,692 |
Source: Public Records
Tax History Compared to Growth
Tax History
| Year | Tax Paid | Tax Assessment Tax Assessment Total Assessment is a certain percentage of the fair market value that is determined by local assessors to be the total taxable value of land and additions on the property. | Land | Improvement |
|---|---|---|---|---|
| 2025 | $9,312 | $68,800 | $17,200 | $51,600 |
| 2024 | $9,082 | $68,800 | $17,200 | $51,600 |
| 2023 | $9,082 | $68,800 | $17,200 | $51,600 |
| 2022 | $8,528 | $68,800 | $17,200 | $51,600 |
| 2021 | $8,440 | $68,800 | $17,200 | $51,600 |
| 2020 | $8,162 | $68,800 | $17,200 | $51,600 |
| 2019 | $7,955 | $68,800 | $17,200 | $51,600 |
| 2018 | $7,746 | $68,800 | $17,200 | $51,600 |
| 2017 | $7,590 | $68,800 | $17,200 | $51,600 |
| 2016 | $7,518 | $68,800 | $17,200 | $51,600 |
| 2015 | $7,370 | $68,800 | $17,200 | $51,600 |
| 2014 | $7,194 | $68,800 | $17,200 | $51,600 |
Source: Public Records
Map
Nearby Homes