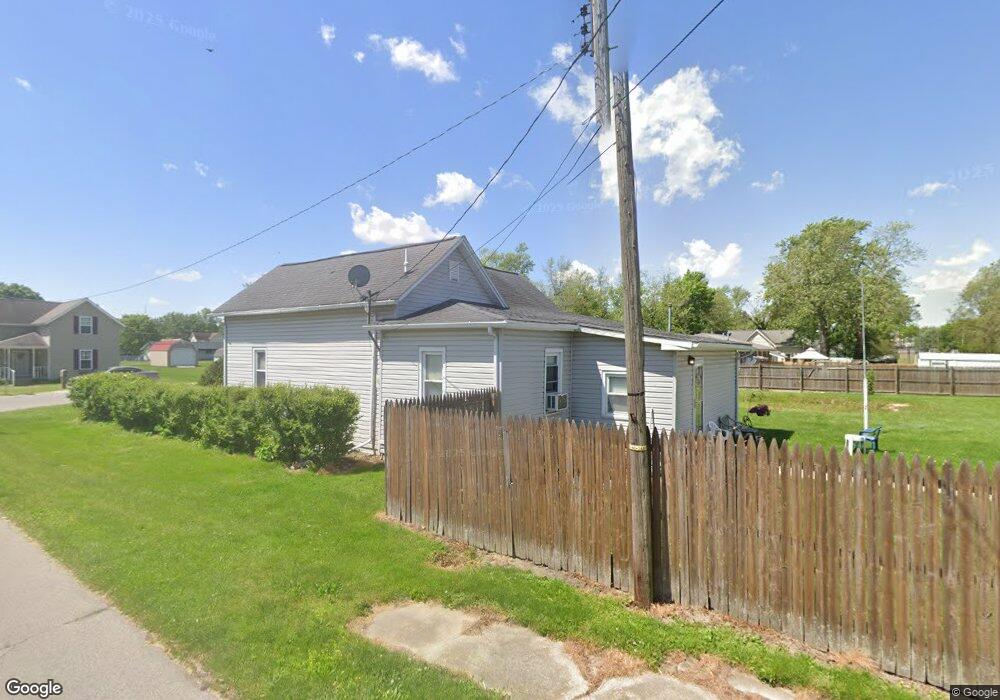
331 E South F St Gas City, IN 46933
Estimated Value: $139,000 - $153,596
3
Beds
1
Bath
1,633
Sq Ft
$89/Sq Ft
Est. Value
About This Home
This home is located at 331 E South F St, Gas City, IN 46933 and is currently estimated at $145,649, approximately $89 per square foot. 331 E South F St is a home located in Grant County with nearby schools including Westview Elementary School, Northview Elementary School, and R.J. Baskett Middle School.
Ownership History
Date
Name
Owned For
Owner Type
Purchase Details
Closed on
Sep 19, 2008
Sold by
Burnside Phillip D and Burnside Shannon M
Bought by
Williams William Lee
Current Estimated Value
Home Financials for this Owner
Home Financials are based on the most recent Mortgage that was taken out on this home.
Original Mortgage
$78,668
Outstanding Balance
$52,325
Interest Rate
6.52%
Mortgage Type
FHA
Estimated Equity
$93,324
Create a Home Valuation Report for This Property
The Home Valuation Report is an in-depth analysis detailing your home's value as well as a comparison with similar homes in the area
Home Values in the Area
Average Home Value in this Area
Purchase History
| Date | Buyer | Sale Price | Title Company |
|---|---|---|---|
| Williams William Lee | $79,900 | Pioneer Title | |
| Williams William L | -- | None Available |
Source: Public Records
Mortgage History
| Date | Status | Borrower | Loan Amount |
|---|---|---|---|
| Open | Williams William L | $78,668 |
Source: Public Records
Tax History Compared to Growth
Tax History
| Year | Tax Paid | Tax Assessment Tax Assessment Total Assessment is a certain percentage of the fair market value that is determined by local assessors to be the total taxable value of land and additions on the property. | Land | Improvement |
|---|---|---|---|---|
| 2024 | $863 | $107,800 | $15,000 | $92,800 |
| 2023 | $754 | $98,700 | $15,000 | $83,700 |
| 2022 | $607 | $85,700 | $13,000 | $72,700 |
| 2021 | $436 | $75,000 | $13,000 | $62,000 |
| 2020 | $415 | $75,000 | $13,000 | $62,000 |
| 2019 | $432 | $76,600 | $13,000 | $63,600 |
| 2018 | $405 | $76,600 | $13,000 | $63,600 |
| 2017 | $374 | $74,400 | $13,000 | $61,400 |
| 2016 | $340 | $71,800 | $13,000 | $58,800 |
| 2014 | $326 | $74,000 | $13,000 | $61,000 |
| 2013 | $326 | $63,300 | $8,700 | $54,600 |
Source: Public Records
Map
Nearby Homes
- 416 E South D St
- 416 E South C St
- 313 E South B St
- 624 E South F St
- 219 E South A St
- 316 S 1st St
- 614 E South A St
- 521 E North A St
- 312 E North C St
- 120 W North A St
- 804 S 10th St
- 1131a E Main St
- 408 Walnut Dr
- 128 W North St E
- 117 W North F St
- 217 N 10th St
- 311 Douglas St
- 303 S Main St
- 903 S Water St
- 517 S Main St
- 403 E South F St
- 325 E South F St
- 330 E South F St
- 406 E South St E
- 407 E South F St
- 320 E South E St
- 324 E South F St
- 404 E South F St
- 406 E South F St
- 406 E South E St
- 320 E South F St
- 317 E South F St
- 411 E South F St
- 410 E South E St
- 315 E South F St
- 312 E South F St
- 401 E South E St
- 415 E South F St
- 414 E South E St
- 718 S 4th St