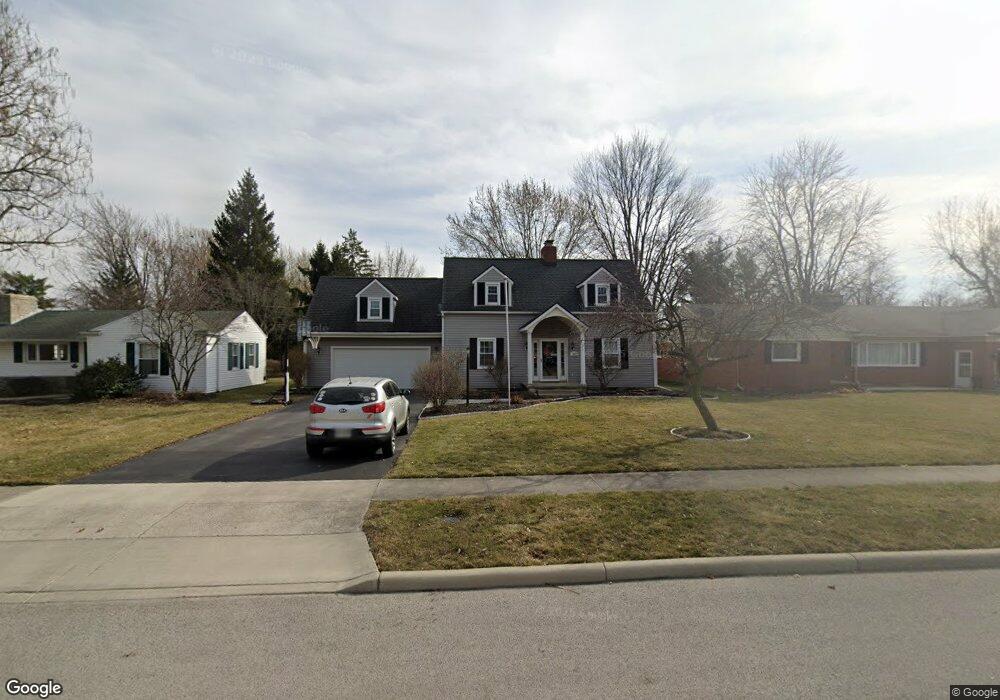
331 Fairlawn Place Findlay, OH 45840
Estimated Value: $253,000 - $288,000
3
Beds
3
Baths
2,405
Sq Ft
$113/Sq Ft
Est. Value
About This Home
This home is located at 331 Fairlawn Place, Findlay, OH 45840 and is currently estimated at $272,195, approximately $113 per square foot. 331 Fairlawn Place is a home located in Hancock County with nearby schools including Jefferson Elementary School, Chamberlin Hill Elementary School, and Donnell Middle School.
Ownership History
Date
Name
Owned For
Owner Type
Purchase Details
Closed on
Nov 21, 2019
Sold by
Pehrson Ronald W and Pehrson Kathryn M
Bought by
Stimmel Matthew Dale and Stimmel Michelle Elizabeth
Current Estimated Value
Home Financials for this Owner
Home Financials are based on the most recent Mortgage that was taken out on this home.
Original Mortgage
$150,000
Outstanding Balance
$101,032
Interest Rate
3.6%
Mortgage Type
New Conventional
Estimated Equity
$171,163
Purchase Details
Closed on
Mar 19, 2019
Sold by
Pehrson Ronald W and Pehrson Kathryn M
Bought by
Pehrson Ronald W and Pehrson Kathryn M
Purchase Details
Closed on
Jan 13, 1992
Bought by
Pehrson Ronald W and Pehrson Kathryn
Create a Home Valuation Report for This Property
The Home Valuation Report is an in-depth analysis detailing your home's value as well as a comparison with similar homes in the area
Home Values in the Area
Average Home Value in this Area
Purchase History
| Date | Buyer | Sale Price | Title Company |
|---|---|---|---|
| Stimmel Matthew Dale | $180,000 | Mid Am Title Agency | |
| Pehrson Ronald W | -- | None Available | |
| Pehrson Ronald W | $105,000 | -- |
Source: Public Records
Mortgage History
| Date | Status | Borrower | Loan Amount |
|---|---|---|---|
| Open | Stimmel Matthew Dale | $150,000 |
Source: Public Records
Tax History Compared to Growth
Tax History
| Year | Tax Paid | Tax Assessment Tax Assessment Total Assessment is a certain percentage of the fair market value that is determined by local assessors to be the total taxable value of land and additions on the property. | Land | Improvement |
|---|---|---|---|---|
| 2024 | $2,677 | $75,300 | $8,900 | $66,400 |
| 2023 | $2,681 | $75,300 | $8,900 | $66,400 |
| 2022 | $2,671 | $75,300 | $8,900 | $66,400 |
| 2021 | $2,578 | $63,300 | $8,890 | $54,410 |
| 2020 | $2,578 | $63,300 | $8,890 | $54,410 |
| 2019 | $2,501 | $62,680 | $8,890 | $53,790 |
| 2018 | $2,255 | $50,490 | $7,120 | $43,370 |
| 2017 | $1,127 | $50,490 | $7,120 | $43,370 |
| 2016 | $2,166 | $50,490 | $7,120 | $43,370 |
| 2015 | $2,222 | $50,770 | $8,300 | $42,470 |
| 2014 | $2,223 | $50,770 | $8,300 | $42,470 |
| 2012 | $2,240 | $50,770 | $8,300 | $42,470 |
Source: Public Records
Map
Nearby Homes
- 1727 Washington Ave
- 211 Fairlawn Place
- 1705 S Main St
- 1621 S Main St
- 200 E Edgar Ave
- 123 Glendale Ave
- 242 E Yates Ave
- 804 6th St
- 1109 Park St
- 1421 Hurd Ave
- 420 1st St
- 1115 Liberty St
- 164 Church Hill Dr
- 1726 Eastview Dr
- 1008 Eastview Dr
- 1709 Eastview Dr
- 202 Hancock St
- 1011 Stall Dr
- 829 Maple Ave
- 905 S West St
- 337 Fairlawn Place
- 321 Fairlawn Place
- 343 Fairlawn Place
- 315 Fairlawn Place
- 230 E Pearl St
- 228 E Pearl St
- 234 E Pearl St
- 349 Fairlawn Place
- 222 E Pearl St
- 1720 Washington Ave
- 330 Fairlawn Place
- 240 E Pearl St
- 338 Fairlawn Place
- 320 Fairlawn Place
- 307 Fairlawn Place
- 218 E Pearl St
- 342 Fairlawn Place
- 318 Fairlawn Place
- 246 E Pearl St
- 312 Fairlawn Place