Estimated Value: $131,000 - $148,000
--
Bed
--
Bath
880
Sq Ft
$159/Sq Ft
Est. Value
About This Home
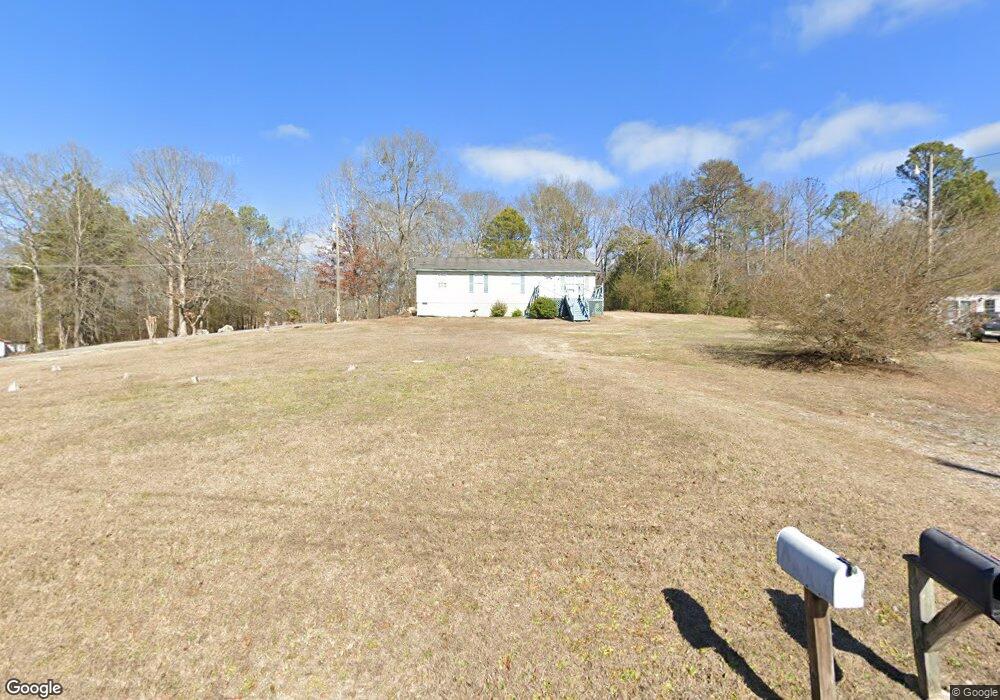
This home is located at 331 Hasty Rd NE, Rome, GA 30161 and is currently estimated at $140,161, approximately $159 per square foot. 331 Hasty Rd NE is a home located in Floyd County with nearby schools including Model Middle School, Model High School, and Unity Christian School.
Ownership History
Date
Name
Owned For
Owner Type
Purchase Details
Closed on
Aug 17, 2011
Sold by
Walter Mtg Co
Bought by
Brown Mary
Current Estimated Value
Purchase Details
Closed on
May 10, 2011
Sold by
Jackson James N
Bought by
Walter Mtg Co
Purchase Details
Closed on
Aug 17, 2004
Sold by
Jackson James N and Jackson Lisa C
Bought by
Jackson Lisa C
Purchase Details
Closed on
Jan 15, 1998
Sold by
Allen Alex and Annie Mae
Bought by
Allen Alex Sr 12 and 24 Int
Purchase Details
Closed on
Jan 9, 1998
Sold by
Jackson James N and Jackson 11 Lisa C
Bought by
Jackson James N and Jackson Lisa C
Purchase Details
Closed on
Nov 29, 1997
Sold by
Jackson James N and Jackson 8 Lisa C
Bought by
Jackson James N and Jackson 9 Lisa C
Purchase Details
Closed on
Nov 28, 1997
Sold by
Opal Perkins 1 and 12 Int
Bought by
Jackson James N and Jackson 8 Lisa C
Purchase Details
Closed on
Nov 27, 1997
Sold by
Jackson James N and Jackson 10 Lisa C
Bought by
Jackson James N and Lisa C Jackson 11/12 I
Purchase Details
Closed on
Jan 1, 1948
Bought by
Allen Alex and Annie Mae
Create a Home Valuation Report for This Property
The Home Valuation Report is an in-depth analysis detailing your home's value as well as a comparison with similar homes in the area
Home Values in the Area
Average Home Value in this Area
Purchase History
| Date | Buyer | Sale Price | Title Company |
|---|---|---|---|
| Brown Mary | $43,000 | -- | |
| Walter Mtg Co | -- | -- | |
| Jackson Lisa C | -- | -- | |
| P | -- | -- | |
| Allen Alex Sr 12 | -- | -- | |
| Mccrary Alice 1 | -- | -- | |
| Opal Perkins 1 | -- | -- | |
| Jackson James N | $1,000 | -- | |
| Jackson James N | $1,000 | -- | |
| Jackson James N | $1,000 | -- | |
| Jackson James N | $1,000 | -- | |
| Allen Alex | -- | -- |
Source: Public Records
Tax History Compared to Growth
Tax History
| Year | Tax Paid | Tax Assessment Tax Assessment Total Assessment is a certain percentage of the fair market value that is determined by local assessors to be the total taxable value of land and additions on the property. | Land | Improvement |
|---|---|---|---|---|
| 2024 | $1,479 | $47,624 | $6,380 | $41,244 |
| 2023 | $1,363 | $40,838 | $5,800 | $35,038 |
| 2022 | $949 | $31,982 | $4,740 | $27,242 |
| 2021 | $745 | $24,679 | $4,322 | $20,357 |
| 2020 | $646 | $21,235 | $3,758 | $17,477 |
| 2019 | $610 | $20,323 | $3,758 | $16,565 |
| 2018 | $577 | $19,163 | $3,579 | $15,584 |
| 2017 | $555 | $18,393 | $3,314 | $15,079 |
| 2016 | $552 | $18,075 | $3,280 | $14,795 |
| 2015 | $539 | $18,075 | $3,280 | $14,795 |
| 2014 | $539 | $18,075 | $3,280 | $14,795 |
Source: Public Records
Map
Nearby Homes
- 492 Moran Lake Rd NE
- 121 Hasty Rd NE
- 0 Scarlett Ln Unit 10548767
- 0 Scarlett Ln Unit 7601914
- 0 Moran Lake Rd NE Unit 10592848
- 0 Moran Lake Rd NE Unit 7639960
- 0 Moran Lake Rd NE Unit 229 10584708
- 118 Dekle Dr NE
- 0 Carrington Place NE Unit 7512224
- 0 Carrington Place NE Unit 10443994
- 16 Barnesdale Way NE
- 6 Friar Tuck Rd NE
- 26 Greer Dr NE
- 108 Dekle Dr NE
- 109 Dekle Dr NE
- 5 Larkwood Dr NE
- 45 Wildflower Rd NE
- 424 Wayside Rd NE
- 22 Robin Hood Rd NE
- 3 Dekle Dr NE
- 332 Hasty Rd NE
- 317 Hasty Rd NE
- 289 Hasty Rd NE
- 289 Hasty Rd NE
- 270 Hasty Rd NE
- 270 Hasty Rd NE
- 251 Hasty Rd NE
- 381 Moran Lake Rd NE
- 465 Moran Lake Rd NE
- 286 Hasty Rd NE
- 286 Hasty Rd NE
- 190 Hasty Rd NE
- 361 Moran Lake Rd NE
- 60 Goody Rd NE
- 392 Moran Lake Rd NE
- 392 Moran Lake Rd NE
- 341 Moran Lake Rd NE
- 378 Moran Lake Rd NE
- 378 Moran Lake Rd NE
- 378 Moran Lake Rd NE