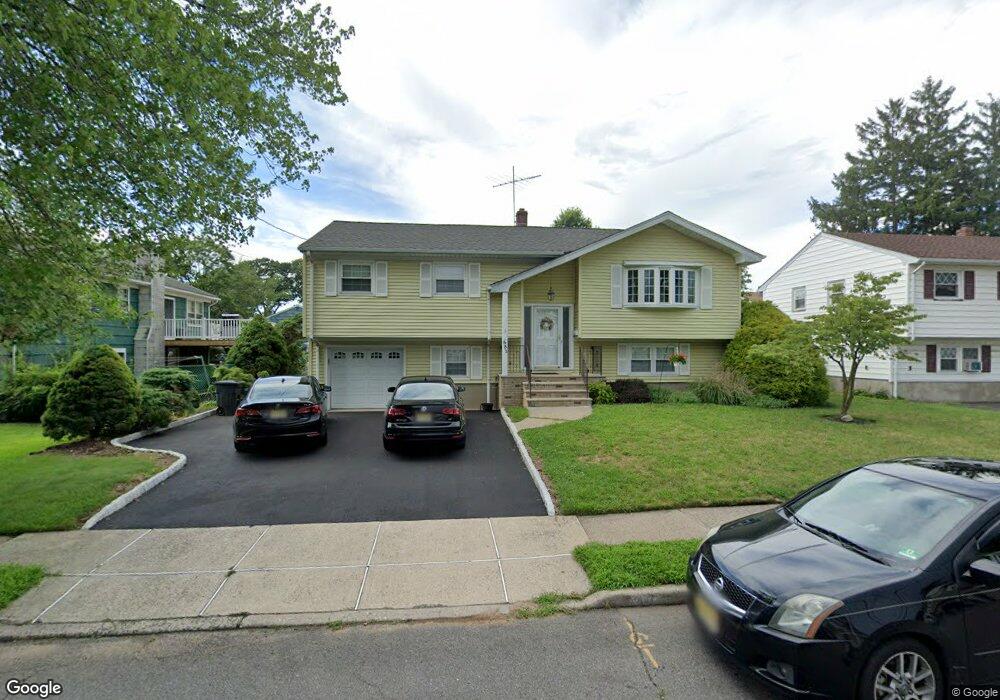
331 Heimstrand Ct Saddle Brook, NJ 07663
Estimated Value: $692,525 - $859,000
Studio
--
Bath
2,000
Sq Ft
$384/Sq Ft
Est. Value
About This Home
This home is located at 331 Heimstrand Ct, Saddle Brook, NJ 07663 and is currently estimated at $767,131, approximately $383 per square foot. 331 Heimstrand Ct is a home located in Bergen County with nearby schools including Saddle Brook Mid High School and Noble Leadership Academy.
Ownership History
Date
Name
Owned For
Owner Type
Purchase Details
Closed on
Nov 1, 2000
Sold by
Tommas Richard
Bought by
Pennisi Joseph and Pennisi Karen
Current Estimated Value
Home Financials for this Owner
Home Financials are based on the most recent Mortgage that was taken out on this home.
Original Mortgage
$240,000
Outstanding Balance
$87,804
Interest Rate
7.78%
Estimated Equity
$679,327
Purchase Details
Closed on
Aug 23, 1998
Sold by
Tommas Richard and Tommas Caroline
Bought by
Tommas Richard and Tommas Gale
Create a Home Valuation Report for This Property
The Home Valuation Report is an in-depth analysis detailing your home's value as well as a comparison with similar homes in the area
Home Values in the Area
Average Home Value in this Area
Purchase History
| Date | Buyer | Sale Price | Title Company |
|---|---|---|---|
| Pennisi Joseph | $300,000 | -- | |
| Tommas Richard | -- | -- |
Source: Public Records
Mortgage History
| Date | Status | Borrower | Loan Amount |
|---|---|---|---|
| Open | Pennisi Joseph | $240,000 |
Source: Public Records
Tax History
| Year | Tax Paid | Tax Assessment Tax Assessment Total Assessment is a certain percentage of the fair market value that is determined by local assessors to be the total taxable value of land and additions on the property. | Land | Improvement |
|---|---|---|---|---|
| 2025 | $11,927 | $541,200 | $240,600 | $300,600 |
| 2024 | $11,622 | $517,200 | $235,600 | $281,600 |
| 2023 | $11,357 | $497,500 | $228,100 | $269,400 |
| 2022 | $11,357 | $472,800 | $215,600 | $257,200 |
| 2021 | $11,049 | $424,300 | $184,100 | $240,200 |
| 2020 | $10,624 | $412,600 | $180,100 | $232,500 |
| 2019 | $10,263 | $395,800 | $177,600 | $218,200 |
| 2018 | $9,892 | $389,900 | $173,100 | $216,800 |
| 2017 | $9,902 | $384,100 | $170,600 | $213,500 |
| 2016 | $10,357 | $361,500 | $160,600 | $200,900 |
| 2015 | $9,815 | $361,500 | $160,600 | $200,900 |
| 2014 | $9,471 | $361,500 | $160,600 | $200,900 |
Source: Public Records
Map
Nearby Homes
- 28 George St
- 38 George St
- 257 Floral Ln
- 471 N Midland Ave Unit 10
- 604 Elm Ave
- 351 Woodcrest Place
- 23-26 Berkshire Rd Unit 1X
- 126 Skillman Terrace
- 23-17 Berkshire Rd Unit 1X
- 66 Jamros Terrace
- 21-10 Carlisle Place Unit 1X
- 281 Cory Ln
- 128 Bell Ave
- 4142 Cory Ln
- 134 Cory Ln
- 132 Cory Ln Unit C0132
- 340 E 54th St
- 260 Washington Ave
- 41 15th Ave
- 82 Birk St
- 12 Lyndon Place
- 325 Heimstrand Ct
- 332 Floral Ln
- 319 Heimstrand Ct
- 6 Lyndon Place
- 326 Floral Ln
- 332 Heimstrand Ct
- 338 Heimstrand Ct
- 326 Heimstrand Ct
- 320 Floral Ln
- 345 Heimstrand Ct
- 9 Lyndon Place
- 342 Heimstrand Ct
- 313 Heimstrand Ct
- 320 Heimstrand Ct
- 346 Floral Ln
- 310 Floral Ln
- 346 Heimstrand Ct
- 316 Heimstrand Ct
- 285 John Ochs Dr
Your Personal Tour Guide
Ask me questions while you tour the home.